IGMIN: We're glad you're here. Please click 'create a new query' if you are a new visitor to our website and need further information from us.
If you are already a member of our network and need to keep track of any developments regarding a question you have already submitted, click 'take me to my Query.'
Welcome to IgMin Research – an Open Access journal uniting Biology, Medicine, and Engineering. We’re dedicated to advancing global knowledge and fostering collaboration across scientific fields.
At IgMin Research, we bridge the frontiers of Biology, Medicine, and Engineering to foster interdisciplinary innovation. Our expanded scope now embraces a wide spectrum of scientific disciplines, empowering global researchers to explore, contribute, and collaborate through open access.
Welcome to IgMin, a leading platform dedicated to enhancing knowledge dissemination and professional growth across multiple fields of science, technology, and the humanities. We believe in the power of open access, collaboration, and innovation. Our goal is to provide individuals and organizations with the tools they need to succeed in the global knowledge economy.
IgMin Publications Inc., Suite 102, West Hartford, CT - 06110, USA
High-voltage direct-current (HVDC) transmission schemes are designed for high transfer capability and long-distance delivery. Still, their reliability can be significantly affected by lightning, as even relatively infrequent lightning faults can interrupt large power transfers. This study examines the lightning performance of the positive and negative poles of the Inga–Kolwezi ±500 kV HVDC scheme in the Democratic Republic of Congo, with particular attention to the unusual configuration in which the two poles are implemented as independent monopolar lines. The supplied technical record describes a 517 km section of the approximately 1,700 km scheme and provides system, fault, lightning-exposure and lightning-detection information. The methodology combines a review of the line configuration and insulation parameters, analysis of operational fault records, and interpretation of Fault Analysis and Lightning Location System (FALLS) Small Area Exposure (SAE) data over ten years from 1 April 2010 to 1 April 2020 within a 1 km buffer around each line. The theoretical interpretation is based on electro-geometric and leader-progression concepts and on the polarity-dependent interaction between the DC operating voltage and negative downward lightning. The source record reports lightning-related faults between 2015 and 2023, including ten shielding-failure events and five back-flashovers, with shielding-failure events associated with comparatively low peak currents, including 15 and 35 kA, while back-flashovers are associated with much higher reported amplitudes of 105 and 135 kA. The supplied material further indicates that a positive 500 kV pole can have a substantially increased shielding-failure rate under a negative downward leader, whereas the negative pole is more susceptible to direct negative-stroke flashover and the positive pole to back-flashover. These results support the conclusion that lightning performance cannot be evaluated from shielding geometry alone; pole polarity, conductor position, insulation coordination, grounding and the quality of lightning-location data must be considered jointly. The principal recommendation is therefore to complete the comparative assessment with pole-specific exposure and outage denominators and to use the resulting dataset to calibrate protection and maintenance priorities along the two independent lines.
High-voltage transmission infrastructure is increasingly required to move large blocks of energy over long distances while maintaining high availability. HVDC technology is particularly suited to such applications because of its large transfer capability and its ability to connect remote generation and major load centres. The reliability requirement becomes more demanding as line length increases, because a single lightning-induced interruption can affect a large amount of transferred power. The supplied Inga–Kolwezi study explicitly identifies this tension between the comparatively low incidence of lightning faults and the high consequence of outages on long HVDC links. Recent research continues to show that lightning performance depends not only on line insulation but also on conductor arrangement, polarity, grounding and the representation used for the lightning attachment and flashover processes [11Andreotti A, Araneo R, Brandão Faria J, He J, Petrache E, Pierno A, et al. On the role of shield wires in mitigating lightning-induced overvoltages in overhead lines-Part I: a critical review and a new analysis. IEEE Trans Power Deliv. 2023;38(1):335-344. Available from: https://ieeexplore.ieee.org/stamp/stamp.jsp?arnumber=9822977,22Moraes AAC, Silveira FH, Visacro S. Assessing the impact of DC bipole configuration on the lightning performance of an HVDC transmission line in terms of backflashover. Electr Power Syst Res. 2025;239:111174. Available from: doi:10.1016/j.epsr.2024.111174.].
The Inga–Kolwezi scheme is an especially valuable case study because the positive and negative poles are not located on a conventional common bipole tower. Instead, the poles are carried on separate monopolar structures following the same general route but separated laterally. The supplied study describes a 517 km section of the approximately 1.700 km HVDC scheme and notes that the separation of the two lines makes it possible to attribute detected lightning strokes to either pole with comparatively high spatial discrimination while assuming broadly similar meteorological exposure. This unusual architecture creates an empirical opportunity to investigate whether the polarity of the DC conductor is associated with a measurable difference in lightning-related performance rather than merely inferring the effect from a conventional double-circuit geometry [33He H, He J, Zhang D, Ding L, Jiang Z, Wang C, et al. Experimental study on lightning shielding performance of ±500 kV HVDC transmission lines. In: 2009 Asia-Pacific Power and Energy Engineering Conference; 2009. p. 1-7. Available from: https://ieeexplore.ieee.org/document/4918362,44He J, Tu Y, Zeng R, Lee J. Numerical analysis model for shielding failure of transmission line under lightning stroke. IEEE Trans Power Deliv. 2005;20(2):815-822.].
The state of the art has established several mechanisms relevant to this problem. Leader-progression and electro-geometric approaches are widely used to evaluate shielding failure and the exposure of overhead conductors to downward lightning [55Dellera L, Garbagnati E. Lightning stroke simulation by means of the leader progression model. Part I: description of the model and evaluation of exposure of free-standing structures. IEEE Trans Power Deliv. 1990;5(4):2009-2022.-88Bank Tavakoli MR, Vahidi B. Transmission-lines shielding failure-rate calculation by means of 3-D leader progression models. IEEE Trans Power Deliv. 2011;26(2):507-516. Available from: https://ui.adsabs.harvard.edu/link_gateway/2011ITPD...26..507T/doi:10.1109/TPWRD.2010.2042183]. Experimental and numerical work on HVDC lines has also demonstrated that the electric field associated with the DC operating voltage can modify lightning attachment conditions and therefore alter the effective attractive radius of a pole conductor [33He H, He J, Zhang D, Ding L, Jiang Z, Wang C, et al. Experimental study on lightning shielding performance of ±500 kV HVDC transmission lines. In: 2009 Asia-Pacific Power and Energy Engineering Conference; 2009. p. 1-7. Available from: https://ieeexplore.ieee.org/document/4918362,99Cuaran J, Becerra M, Roman F. Lightning attachment to UHV power transmission lines: effect of the phase voltage. IEEE Trans Power Deliv. 2019;34(2):729-738. Available from: https://www.scribd.com/document/952936440/Lightning-Attachment-to-UHV-Power-Transmission-Lines-Effect-of-the-Phase-Voltage]. In parallel, studies of back-flashover show that tower-footing impedance, lightning-current waveform and insulation characteristics strongly affect the resulting overvoltage and flashover probability [1010Han Y, Li L, Chen H, Lu Y. Influence of modeling methods on the calculated lightning surge overvoltages at a UHVDC converter station due to backflashover. IEEE Trans Power Deliv. 2012;27(3):1090-1095.,1111Silveira FH, Visacro S. Lightning performance of transmission lines: impact of current waveform and front-time on backflashover occurrence. IEEE Trans Power Deliv. 2019;34(6):2145-2151. Available from: https://www.researchgate.net/publication/330916025_Lightning_Performance_of_Transmission_Lines_Impact_of_Current_Waveform_and_Front-Time_on_Backflashover_Occurrence].
More recent work reinforces the need to treat polarity and geometry as coupled variables. Moraes, Silveira and Visacro [22Moraes AAC, Silveira FH, Visacro S. Assessing the impact of DC bipole configuration on the lightning performance of an HVDC transmission line in terms of backflashover. Electr Power Syst Res. 2025;239:111174. Available from: doi:10.1016/j.epsr.2024.111174.] assessed several polarity and position arrangements for a 500 kV HVDC line and found that both conductor arrangement and polarity can materially change critical current and back-flashover probability. Their simulations reported critical currents ranging from 96 to 49 kA and corresponding back-flashover probabilities from approximately 4% to 26%, depending on configuration and tower-footing grounding impedance. This is directly relevant to the Inga–Kolwezi problem because it demonstrates that a comparison between positive and negative poles should not be reduced to a simple assumption that both conductors have identical lightning behavior (Mwanda & Nzita, 2025).
A second contemporary line of research examines the adequacy of shielding and insulation design for high-voltage lines with unconventional geometries. Arafat and Ghassemi [1212Arafat E, Ghassemi M. Shielding failure analysis of extra high voltage unconventional transmission lines with increased power delivery capability. Sci Rep. 2025;15:29247. Available from:doi:10.1038/s41598-025-15276-2.], for example, emphasised that shielding failure remains a critical concern for extra-high-voltage transmission lines and that changes in line geometry can require a reassessment of conventional insulation-coordination assumptions (Mwanda& Nzita, 2025). These developments expose a gap that is particularly important for the present case: there is limited field-based evidence comparing the lightning performance of two physically separate HVDC poles exposed to nearly the same regional lightning environment. The Inga–Kolwezi arrangement therefore offers a rare natural comparison in which polarity is a principal variable while many environmental factors are approximately shared.
The scientific contribution sought in this study is consequently to integrate three complementary levels of evidence: the physical interpretation of polarity-dependent lightning attachment and flashover; the documented design characteristics of the ±500 kV Inga–Kolwezi lines; and the available operational and lightning-location records. The objectives are to characterise the study system and its lightning exposure, determine what the available fault evidence reveals about shielding failure and back-flashover, evaluate the plausibility of a polarity-dependent performance difference, and identify the additional measurements required for a statistically defensible pole-to-pole comparison. The study deliberately distinguishes results directly supported by the supplied record from interpretations and recommendations, because the source does not provide the complete pole-specific exposure and outage denominators needed for a formal comparative rate test.
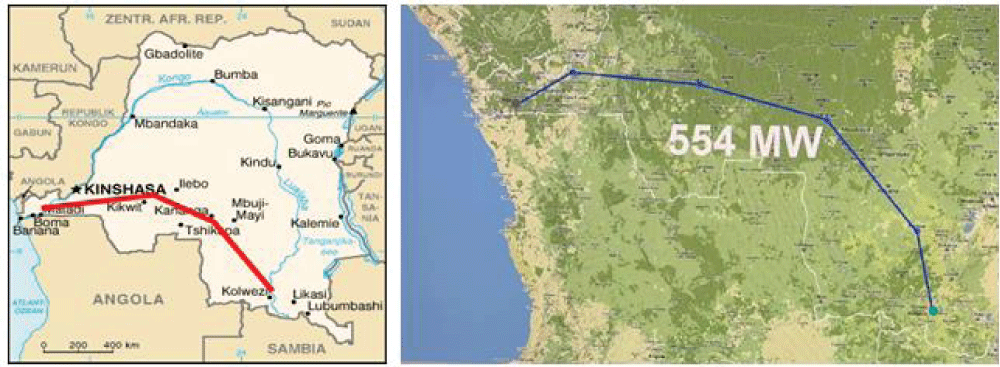
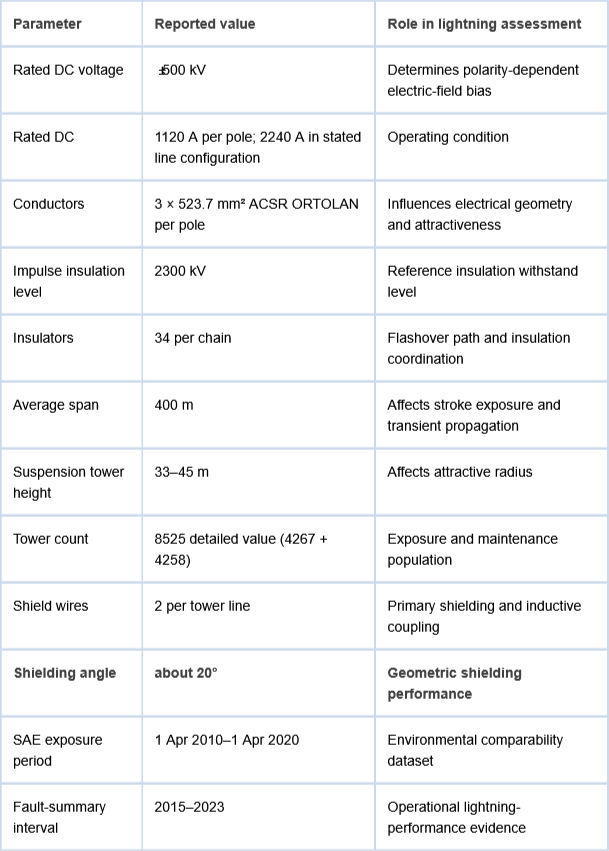
The study area is the Inga–Kolwezi HVDC transmission corridor in the Democratic Republic of Congo. The supplied record describes the compared section as 517 km within an approximately 1700 km scheme linking the Inga hydroelectric generation complex to the Kolwezi converter station in the south of the former Katanga region. The two ±500 kV poles are implemented as independent lines on self-supporting monopolar structures rather than as a conventional bipolar tower in Figure 1. The source gives a nominal voltage of ±500 kV, rated current values of 1120 A per pole for the relevant operating configuration, and a maximum line current of 2.240 A when the stated converter arrangement is considered. The line uses three 523.7 mm² ACSR ORTOLAN conductors per pole, an insulation level of 2300 kV for the stated 1.5/50 impulse condition, 34 insulators per string, an average span of approximately 400 m and suspension-tower heights between 33 and 45 m. The detailed system-features section reports 8525 lattice towers in total, comprising 4267 on pole 1 and 4258 on pole 2. The introductory section of the source contains a separate figure of 8523 towers; this manuscript retains the detailed system-features value of 8525 and explicitly notes the source discrepancy rather than silently reconciling [22Moraes AAC, Silveira FH, Visacro S. Assessing the impact of DC bipole configuration on the lightning performance of an HVDC transmission line in terms of backflashover. Electr Power Syst Res. 2025;239:111174. Available from: doi:10.1016/j.epsr.2024.111174.].
Figure 1: Inga–Kolwezi HVDC scheme and route context reproduced from the supplied study.
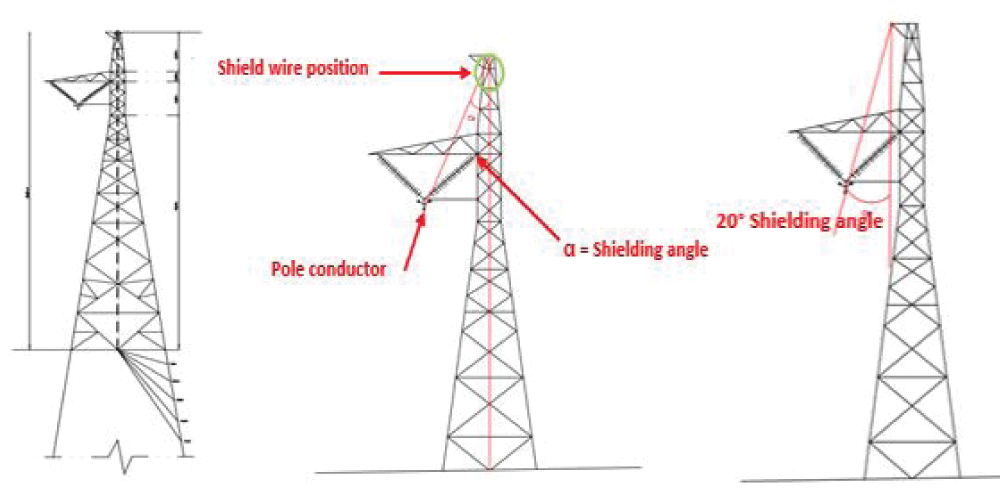
The line configuration is particularly relevant to lightning analysis because each pole has two shield wires and a relatively steep shielding geometry, with the supplied study giving a shielding angle of about 20°. The close positioning of the shield wires and pole conductors increases inductive coupling and is expected to reduce the voltage difference between shield wire or tower and pole conductor during a shield-wire strike, thereby reducing the probability of back-flashover. At the same time, the DC operating voltage changes the electrical field around the pole conductor, so that shielding failure and flashover cannot be assessed from geometry alone in Figure 2 [11Andreotti A, Araneo R, Brandão Faria J, He J, Petrache E, Pierno A, et al. On the role of shield wires in mitigating lightning-induced overvoltages in overhead lines-Part I: a critical review and a new analysis. IEEE Trans Power Deliv. 2023;38(1):335-344. Available from: https://ieeexplore.ieee.org/stamp/stamp.jsp?arnumber=9822977,1313Wang X, He J, Yu Z, Zeng R. Influence of ground wire on the initiation of upward leader from 110 to 1000 kV AC phase line. Electr Power Syst Res. 2016;130:103-112.].
Figure 2: Consolidated representation of the independent monopolar tower arrangements for the two poles, based on the supplied figures.
Data collection
The lightning-exposure dataset was obtained from the Fault Analysis and Lightning Location System (FALLS) using the Small Area Exposure (SAE) function. The supplied study states that the available SAE data cover ten years, from 1 April 2010 to 1 April 2020, and that lightning strokes were evaluated within a 1 km buffer around each line. The analysis discriminates lightning exposure by polarity and amplitude and is intended to establish whether the two lines experience sufficiently similar lightning environments for a pole-performance comparison. The use of a spatial buffer is important because the exact attribution of a detected stroke to a particular line depends on the location uncertainty of the lightning-location network [1414Razzaghi R, Scatena M, Sheshyekani K, Paolone M, Rachidi F, Antonini G. Locating lightning strikes and flashovers along overhead power transmission lines using electromagnetic time reversal. Electr Power Syst Res. 2018;160:282-291. Available from: https://doi.org/10.1016/j.epsr.2018.03.012].
Operational fault information was taken from the line performance record. The source states that lightning-related faults observed between 2015 and 2023 included both back-flashover and shielding-failure events. It reports ten shielding failures and five back-flashovers in the illustrated fault summary. A separate operational example records a Line 1 fault on 28 June 2026 at 14:23:01.820508762, with a trip location reported at approximately 1692.2 km and subsequent transfer of load to the other pole. Because this event occurs after the principal 2010–2020 SAE comparison period and after the 2015–2023 fault-summary interval, it is treated here as an illustrative operational event rather than pooled into the main statistical dataset.
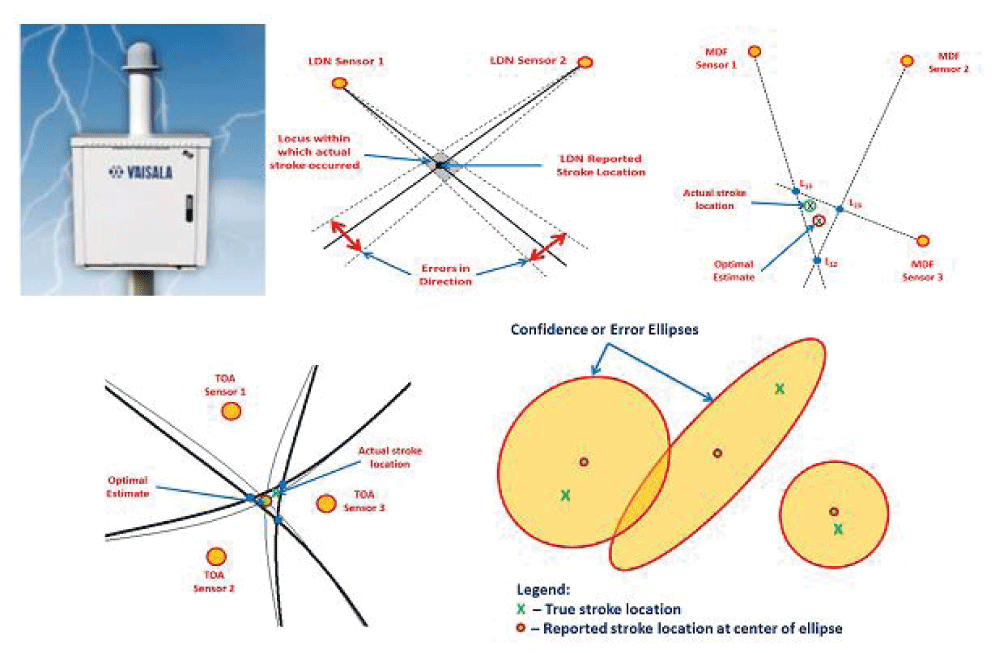
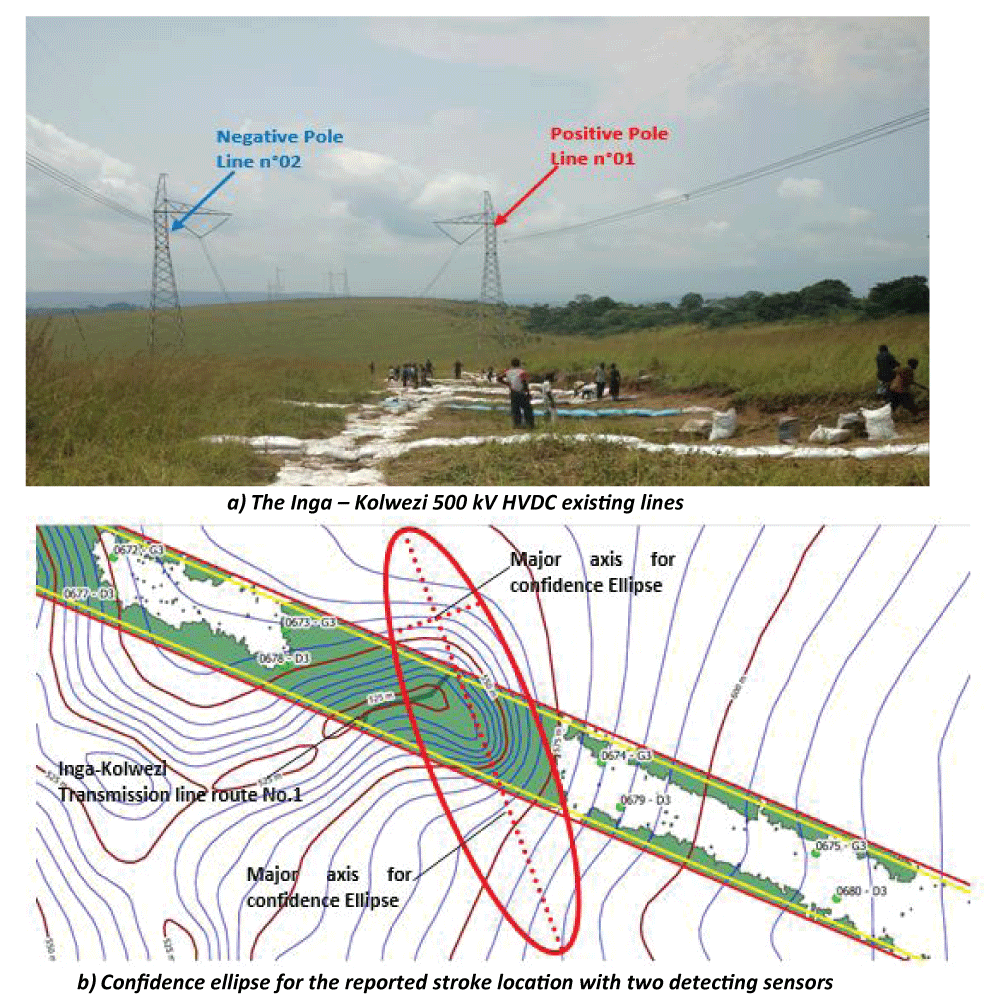
The supplied material also describes the Congolese Democratic Lightning Detection Network (CDLDN), managed by METTELSAT, whose initial network comprised nineteen Vaisala LS7000 cloud-to-ground lightning sensors installed in 2013. The sensors combine low-frequency magnetic direction finding and time-of-arrival information. The location uncertainty depends on the number of sensors detecting the stroke, the stroke current amplitude, and the geometry between the sensors and the stroke. The source reports that events detected by at least three sensors can have location errors of approximately 0.1–2 km in the cited NLDN evaluation, whereas two-sensor solutions may have errors of about 2 km or more. This uncertainty is directly relevant to a comparison between two lines separated by only tens of meters in places in Figure 3.
Figure 3: Consolidated representation of the lightning-detection hardware and MDF/TOA location principles described in the supplied study.
Data analysis
The analysis proceeds by first establishing whether the two lines can reasonably be regarded as similarly exposed to lightning, then separating the physical mechanisms of shielding failure and back-flashover, and finally comparing the implications of the observed current amplitudes with the theoretical polarity effects described in the source. For exposure, the principal unit of analysis is the lightning stroke detected within the 1 km SAE buffer, with polarity and peak-current amplitude retained as explanatory variables. For fault performance, the relevant outcomes are shielding-failure flashover and back-flashover. The comparison is interpreted through electro-geometric and leader-progression concepts, in which the striking distance and attractive radius depend on conductor geometry, tower dimensions, and the electric field established by the line voltage [55Dellera L, Garbagnati E. Lightning stroke simulation by means of the leader progression model. Part I: description of the model and evaluation of exposure of free-standing structures. IEEE Trans Power Deliv. 1990;5(4):2009-2022.,66Dellera L, Garbagnati E. Lightning stroke simulation by means of the leader progression model. Part II: exposure and shielding failure evaluation of overhead lines with assessment of application graphs. IEEE Trans Power Deliv. 1990;5(4):2023-2029.,88Bank Tavakoli MR, Vahidi B. Transmission-lines shielding failure-rate calculation by means of 3-D leader progression models. IEEE Trans Power Deliv. 2011;26(2):507-516. Available from: https://ui.adsabs.harvard.edu/link_gateway/2011ITPD...26..507T/doi:10.1109/TPWRD.2010.2042183].
The polarity mechanism is treated as a causal interpretation rather than as a directly measured effect in the supplied operational dataset. Under a negative downward stroke, the source argues that the negative pole is more vulnerable to direct-stroke flashover because the lightning-induced impulse adds unfavourably to its negative DC bias, lowering the current required to reach insulation flashover. Conversely, the positive pole is expected to be more attractive to a negative downward leader, and its positive DC bias increases insulation stress during a negative impulse, making it more vulnerable to shielding failure and back-flashover. The supplied study reports a factor of 4.84 increase in shielding-failure rate for a +500 kV pole relative to a calculation neglecting line voltage for the considered negative downward leader in Table 1. These theoretical statements are compared with the fault-current evidence rather than assumed to be proven by (Mwanda and Nzita, 2025).
Table 1: Principal electrical and geometric parameters reported for the Inga–Kolwezi ±500 kV HVDC system.
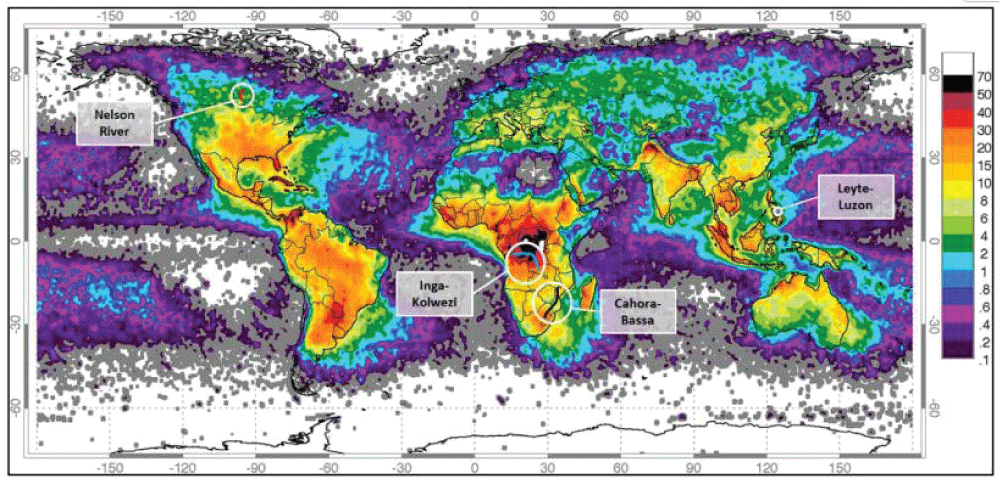
In most cases, high performance is demanded from HVDC schemes for two primary reasons: Firstly, due to the large power transfer capacities of HVDC compared to typical HVAC lines of comparable insulation levels, outages have a proportionately larger impact. Secondly, although the incidence of faults due to lightning may be low compared to other fault mechanisms, typically HVDC lines are relatively long compared to HVAC lines and therefore the impact of faults is emphasized, and commensurately lower fault rates are required for the same availability. This places emphasis on understanding the impact of lightning on HVDC transmission lines, particularly in areas of high lightning activity. A global Lightning Flash Density (LFD) Map in Figure 3 indicates that the LFD varies widely across the globe and highlights the consequent effect on transmission infrastructure. The LFD is given in flashes per km² per year and has been averaged from data over the period from 1995 to 2003. Several HVDC schemes besides Inga - Kolwezi HVDC lines are described and compared later in this chapter: Cahora Bassa (Mozambique), Nelson River (Manitoba, Canada) and Leyte-Luzon (Philippines). These four schemes have been indicated on the map. As can be seen from Figure 4, the lightning exposure and therefore the potential impact of lightning-related outages would vary greatly across these examples. The schemes located in tropical zones, such as the Inga-Kolwezi and the Leyte-Luzon schemes, which experience LFD of 40 - 70 and 10 - 30 respectively, would therefore experience a larger effect due to lightning-induced faults compared to the Nelson River Scheme, which experiences an LFD of 0.2 - 3. In areas of high LFD, it is clear that it would be critical to consider lightning in the design of the transmission lines [1313Wang X, He J, Yu Z, Zeng R. Influence of ground wire on the initiation of upward leader from 110 to 1000 kV AC phase line. Electr Power Syst Res. 2016;130:103-112.].
Figure 4: Global lightning flash-density context and locations of selected HVDC schemes reproduced from the supplied study.
Lightning exposure and suitability of the paired-line comparison: The first result is methodological: the two independent lines are suitable for a comparative lightning study only if their lightning exposure is sufficiently similar. The supplied FALLS SAE analysis was specifically designed for this purpose, using a 1 km buffer and separating lightning strokes by polarity and amplitude. The study therefore establishes the correct comparison logic-environment first, fault performance second-but the numerical SAE totals for each pole are not reproduced in the supplied record. Consequently, the present manuscript can document the existence and design of the ten-year exposure comparison but cannot calculate an exposure ratio, confidence interval, or equality test between the two poles without the underlying SAE export. This limitation is important because similar regional weather does not automatically imply identical local lightning incidence, particularly where the two lines follow slightly different corridors.
The global lightning-density map nevertheless places the case study in a highly exposed environment. The supplied source reports an LFD range of approximately 40–70 flashes km⁻² year⁻¹ for the Inga–Kolwezi region, compared with lower values for the Nelson River scheme and intermediate exposure for Leyte–Luzon. The implication is that even a well-shielded 500 kV line can accumulate a non-negligible population of lightning interactions over thousands of kilometres and many years. This supports the study's emphasis on low fault rates and high consequence rather than on the absolute number of events alone. The broader literature similarly treats shielding, lightning attractiveness and grounding as interacting reliability variables in Figure 5.
Figure 5: Consolidated field and corridor context illustrating the physical environment in which the line and its grounding/electrode infrastructure operate.
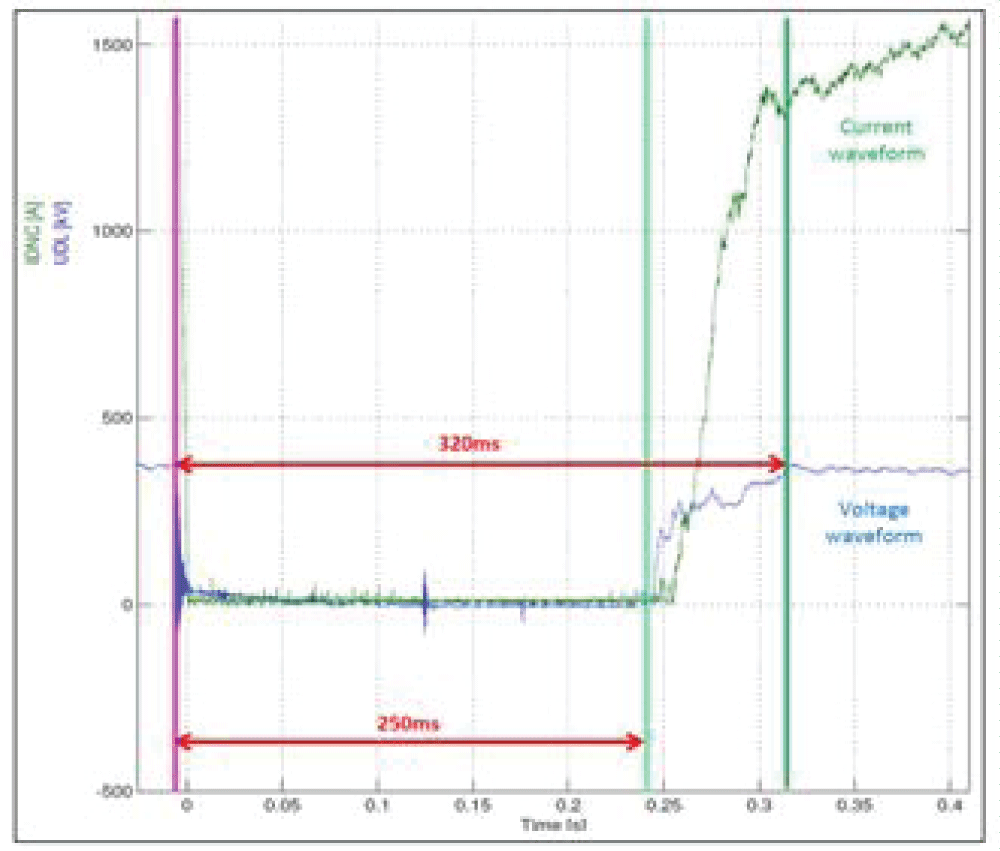
Operational fault behaviour and recovery: The second result concerns the transient consequence of a lightning-related trip. In the illustrative Line 1 event recorded at Inga, the transient fault recorder shows a collapse of voltage to approximately zero for close to 250 ms, followed by a recovery ramp of roughly 50 ms, with normal operational voltage restored after about 320 ms. This observation is consistent with the supplied description of HVDC lockout–unlockout behaviour, in which a lightning-induced flashover produces a momentary interruption before the converter and line return to service. Although the duration is short, the consequence can be significant because large blocks of power are being transferred and because a pole trip can require load transfer to the other pole. The event therefore demonstrates why lightning performance should be evaluated in terms of both fault frequency and operational consequence in Figure 6.
Figure 6: Operational incident record and transient fault-recorder response for the illustrative Line 1 event reported in the source.
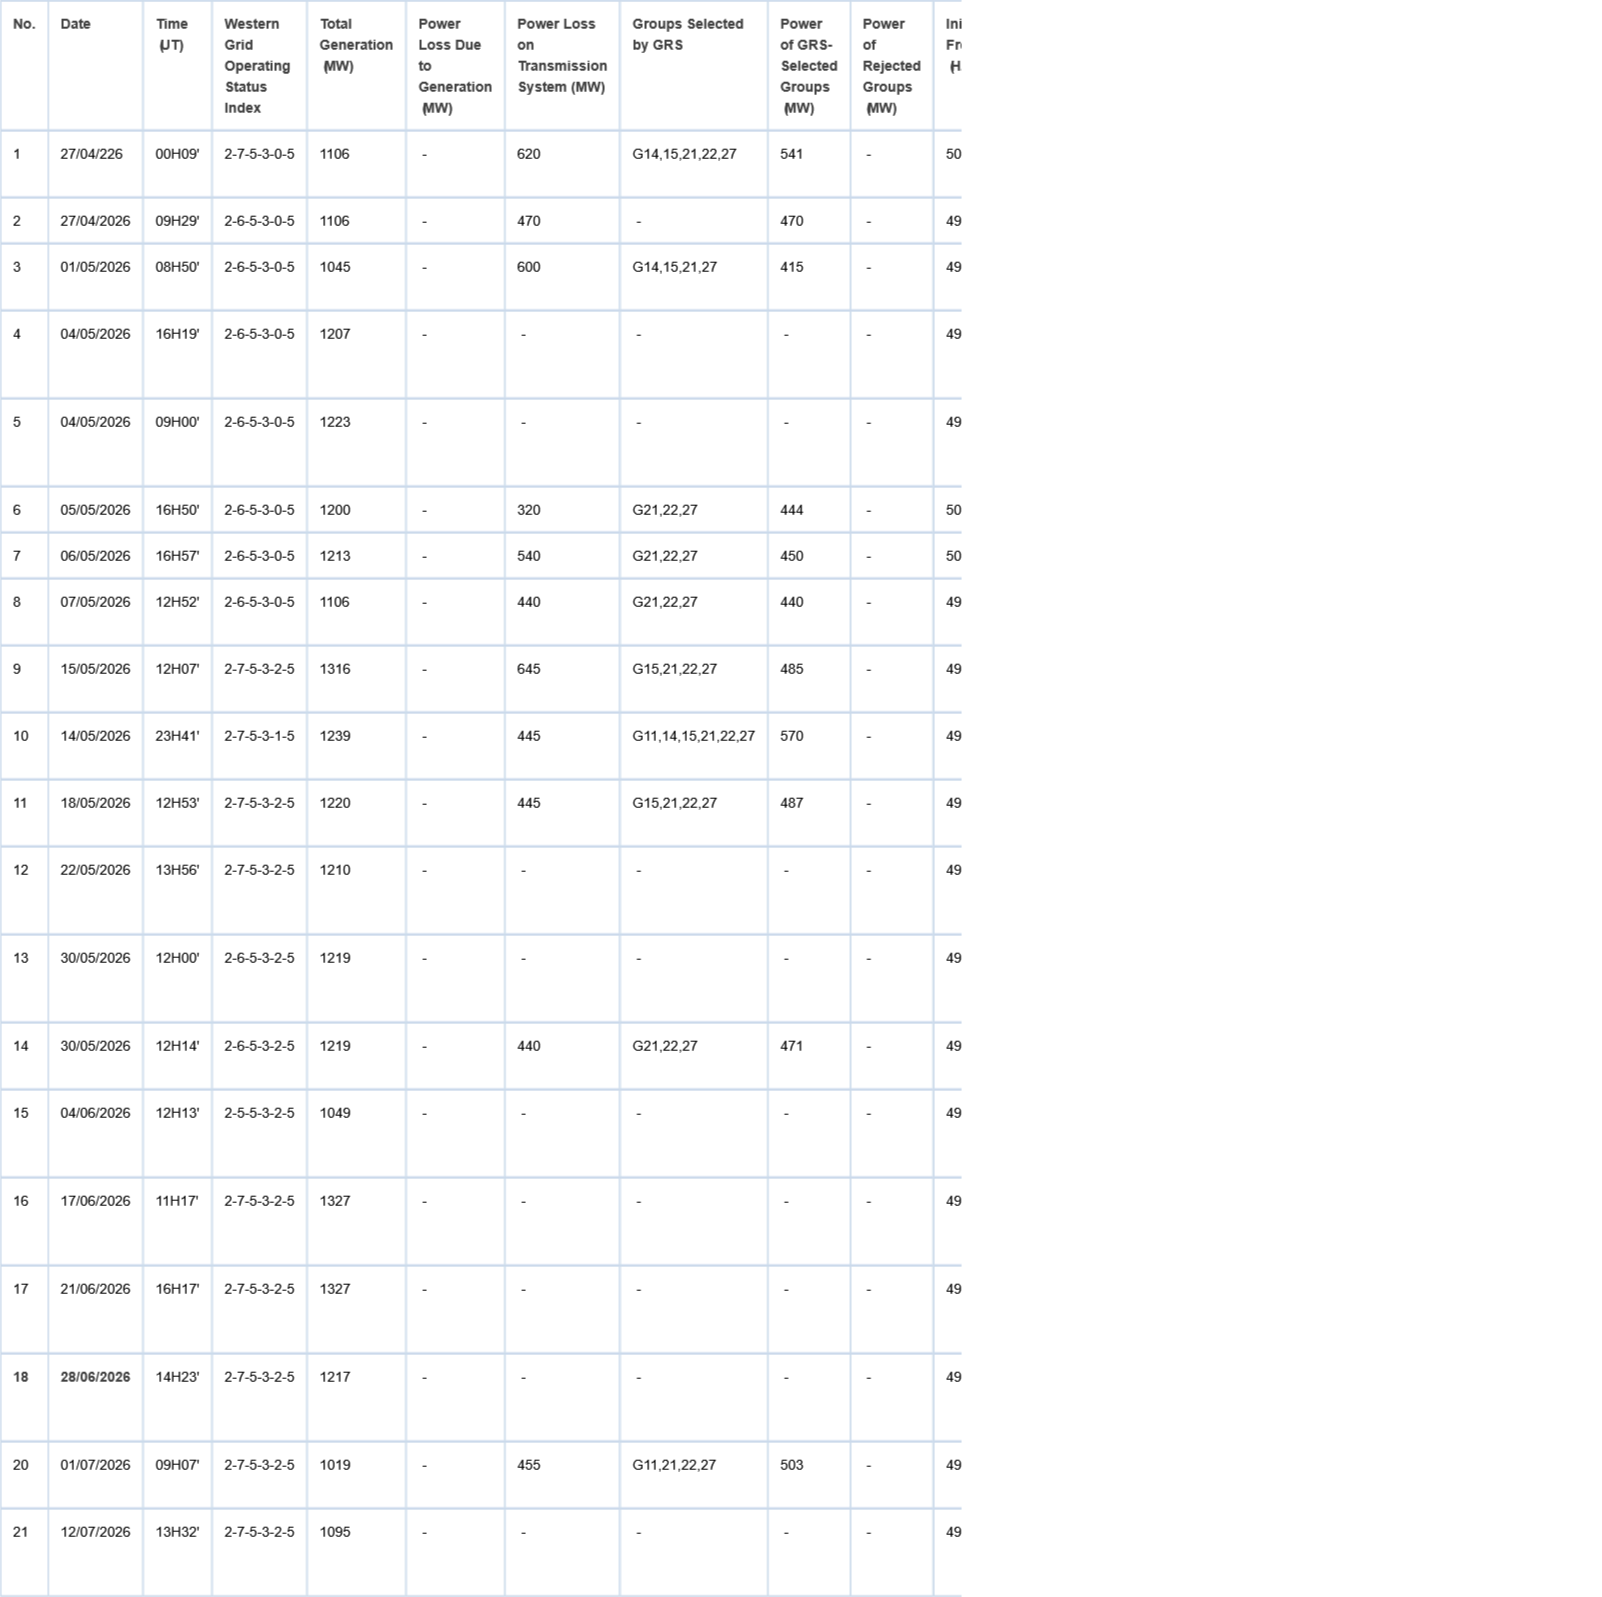
In the case of HVAC overhead lines, faults are interrupted by circuit breakers and after a brief time, usually 320 ms, the line is reconnected in a process called Auto Re-Close (ARC). This results in brief outages which can affect consumers with sensitive processes. Lightning-induced flashovers on HVDC lines also cause momentary outages (lasting approximately 250 ms) during which the voltage drops to zero before being restored (a phenomenon known as “lockout-unlock”). The impact of a fault caused by lightning is illustrated by the following example of a fault that occurred on Inga-Kolwezi Line 1 on June 28, 2026, at 14:23:01.820508762, with the trip occurring at 1.692.2 km, resulting in the tripping of converter 11 (pole 1) and the transfer of loads to converter 21 (pole 2) in Table 2.
Table 2: Summary of Recorded Grid Incidents and Associated Frequency Response Parameters.
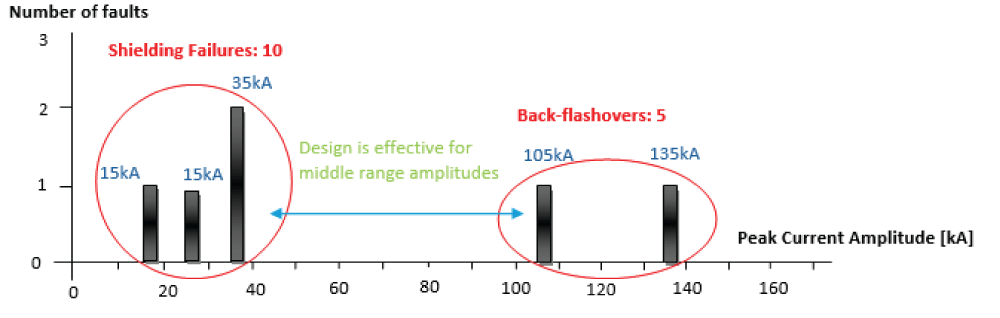
Shielding failure, back-flashover and the role of current amplitude: The third result is that the supplied fault record separates lightning-related failures into two distinct current-amplitude regimes. The fault summary identifies ten shielding failures and five back-flashovers. The accompanying graph places shielding-failure events at relatively low reported peak currents, including 15 kA and 35 kA, whereas the back-flashover examples occur at much higher amplitudes, around 105 kA and 135 kA. The source explicitly notes that the occurrence of a fault at 15 kA is unexpected under the intended shielding-coordination concept because such a current would normally be expected to be below the level required to generate an insulation-threatening overvoltage after a correctly shielded attachment. The evidence therefore points to a possible weakness in shielding coordination, attachment modelling, local geometry, or the attribution of the lightning event to the line. It does not, by itself, identify which of these mechanisms is responsible in Figure 7.
Figure 7: Lightning-related fault-current amplitudes reproduced from the supplied fault-performance graph. The source labels ten shielding failures and five back-flashovers and identifies representative amplitudes of 15/35 kA and 105/135 kA, respectively.
This separation between lower-current shielding failures and higher-current back-flashovers is physically plausible. A shielding failure is primarily an attachment problem: the descending leader bypasses the shield wire and attaches to the pole conductor. Once a pole conductor is struck, the resulting voltage may or may not exceed the insulation withstand depending on the current waveform, line impedance, and DC bias. Back-flashover, in contrast, follows a strike to the tower or shield wire in which the tower potential rises sufficiently relative to the pole conductor to stress the insulator string. The literature has repeatedly shown that the resulting flashover threshold depends on the lightning-current waveform, tower-footing impedance, and line configuration. The Inga–Kolwezi data are therefore consistent with the need to treat shielding failure and back-flashover as separate mechanisms rather than as one generic lightning-fault category.
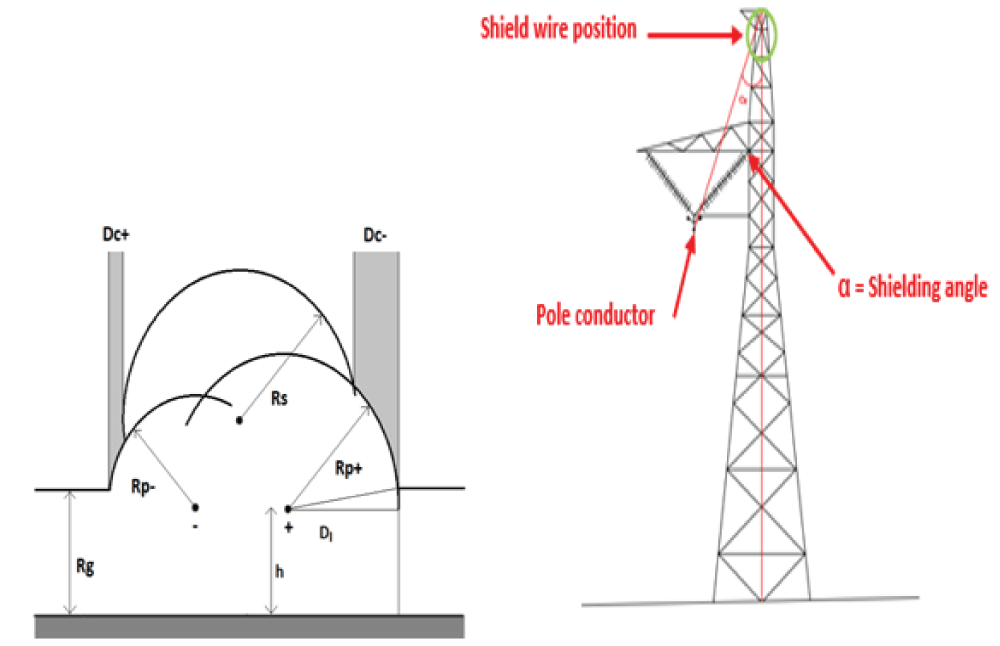
Polarity-dependent mechanisms: The fourth result is theoretical but directly relevant to the field comparison. The supplied study predicts three polarity-dependent tendencies under negative downward lightning. First, the negative pole is more vulnerable to direct negative-stroke flashover because the negative DC operating voltage adds to the negative impulse. Second, the positive pole can be more attractive to the descending negative leader, increasing its effective attractive radius and the probability of shielding failure. Third, the positive pole is more vulnerable to back-flashover because its positive DC bias increases the insulation stress produced by a negative impulse. The source further reports that the calculated contribution of a +500 kV pole voltage can increase the shielding-failure rate by a factor of 4.84 relative to a calculation in which line voltage is neglected in Figure 8.
Figure 8: Consolidated electro-geometric representation of attractive radii and shielding geometry for the HVDC pole conductors.
The polarity interpretation is supported by later modelling work, but it should not be over-generalized and should show that the relative position and polarity of 500 kV HVDC phase conductors can substantially change back-flashover performance, with the worst configurations associated with lower positive phases and with grounding resistance also influencing the outcome. Their results strengthen the physical plausibility of the Inga–Kolwezi hypothesis that the two poles need not have identical lightning performance, while also demonstrating that polarity cannot be isolated from conductor position and tower-footing impedance.
Discussion
The Inga–Kolwezi findings are consistent with the broader development of lightning-performance analysis. Dellera and Garbagnati [55Dellera L, Garbagnati E. Lightning stroke simulation by means of the leader progression model. Part I: description of the model and evaluation of exposure of free-standing structures. IEEE Trans Power Deliv. 1990;5(4):2009-2022.,66Dellera L, Garbagnati E. Lightning stroke simulation by means of the leader progression model. Part II: exposure and shielding failure evaluation of overhead lines with assessment of application graphs. IEEE Trans Power Deliv. 1990;5(4):2023-2029.] established the leader-progression framework for evaluating exposure and shielding failure; subsequent work refined the numerical treatment of shielding failure and the influence of geometry [77Vahidi B, Yahyaabadi M, Bank Tavakoli MR, Ahadi SM. Leader progression analysis model for shielding failure computation by using the charge simulation method. IEEE Trans Power Deliv. 2008;23(4):2201-2206.,88Bank Tavakoli MR, Vahidi B. Transmission-lines shielding failure-rate calculation by means of 3-D leader progression models. IEEE Trans Power Deliv. 2011;26(2):507-516. Available from: https://ui.adsabs.harvard.edu/link_gateway/2011ITPD...26..507T/doi:10.1109/TPWRD.2010.2042183]. Studies of underbuilt shield wires and alternative shielding arrangements have further demonstrated that geometric modifications can materially improve lightning performance when conventional shielding is insufficient [1515Araneo R, Andreotti A, Brandão Faria J, Celozzi S, Assante D, Verolino L. Utilization of underbuilt shield wires to improve the lightning performance of overhead distribution lines hit by direct strokes. IEEE Trans Power Deliv. 2020;35(4):1656-1666. Available from: https://researchportal.ulisboa.pt/en/publications/utilization-of-underbuilt-shield-wires-to-improve-the-lightning-p/,1616Stracqualursi E, Araneo R, Brandão Faria J, Andreotti A. Protection of distribution overhead power lines against direct lightning strokes by means of underbuilt ground wires. Electr Power Syst Res. 2022;202:107571. Available from: https://www.sciencedirect.com/science/article/abs/pii/S0378779621005526]. The present case adds a distinctive field dimension because the two poles are physically separate, making the comparison potentially less confounded by mutual coupling than a conventional double-circuit tower arrangement. At the same time, the 60-meter separation described in the source means that lightning-location uncertainty must be handled carefully, because an incorrectly located stroke can be assigned to the wrong pole. The results also agree with recent evidence that unconventional or high-voltage line geometries should not automatically inherit the protection assumptions of conventional lines. Arafat and Ghassemi [1212Arafat E, Ghassemi M. Shielding failure analysis of extra high voltage unconventional transmission lines with increased power delivery capability. Sci Rep. 2025;15:29247. Available from:doi:10.1038/s41598-025-15276-2.] showed that shielding failure remains a critical design question for extra-high-voltage lines and that changes in line configuration can require renewed assessment of transient overvoltages and insulation coordination (Mwanda & Nzita, 2025). The Inga–Kolwezi case therefore supports a broader design principle: protection criteria should be derived from the actual geometry, polarity, grounding and lightning environment of the line, and then validated against operational data rather than transferred unchanged from another line class [1717Xemard A, Sellin E, Tarafi R, Bertinato A, Verrax P. Lightning overvoltages on a DC transmission line, calculated based on measured bipolar lightning strokes. Electr Power Syst Res. 2021:107331. Available from: https://www.researchgate.net/publication/351562868_Lightning_overvoltages_on_a_DC_transmission_line_calculated_based_on_measured_bipolar_lightning_strokes]. The natural statistical hypothesis is H0: the lightning-fault rate is independent of pole polarity after accounting for lightning exposure; H1: the fault rate differs between the positive and negative poles. A defensible test would require, for each pole, the number of lightning strokes in the defined exposure buffer, the number of shielding failures, the number of back-flashovers, and preferably the corresponding exposure by current-amplitude class. The supplied record does not reproduce these pole-specific counts or the numerical SAE exposure totals. Therefore, a chi-square test, Fisher exact test, or Poisson rate-ratio confidence interval cannot be calculated without introducing assumptions that are not supported by the source. The appropriate conclusion at this stage is not that H0 is accepted, but that the available excerpt is insufficient to reject or retain H0 statistically. The theoretical and operational evidence instead provides a testable mechanistic hypothesis that should be evaluated on the complete underlying dataset. The missing information is also necessary for controlling possible confounding. If one pole receives more high-current strokes, more strokes are detected by three or more sensors, or more events fall within regions of low location uncertainty, an apparent polarity difference in fault counts could be partly due to exposure or detection quality. The recommended analysis is therefore a pole-specific Poisson or negative-binomial rate model using lightning exposure as an offset and current amplitude, stroke polarity, tower location, grounding condition, and detection confidence as explanatory variables. Where event counts are small, exact rate-ratio intervals and bootstrap sensitivity analysis should supplement asymptotic tests. This approach would extend the original study from a qualitative comparison into a statistically reproducible lightning-performance assessment. The first recommendation is to recover and archive the complete FALLS SAE export for the two lines, including stroke counts, polarity, peak current, location uncertainty, and the number of detecting sensors. The second is to establish a pole-specific fault database in which every event is classified as shielding failure, back-flashover, non-lightning fault or uncertain, with the tower, span, pole polarity, lightning coordinates and current amplitude retained. The third is to investigate all low-current shielding failures, particularly the reported 15 kA cases, because their occurrence challenges the intended coordination between shielding and insulation. The fourth is to verify tower-footing resistance and grounding continuity at recurrent fault locations, since back-flashover is strongly dependent on the tower potential generated by lightning current. The fifth is to reassess the protection geometry with an electro-geometric or leader-progression model that explicitly includes the ±500 kV operating voltage rather than treating the poles as electrically neutral conductors. These recommendations follow the source evidence and are consistent with the broader literature on shield-wire geometry, grounding and pole configuration [11Andreotti A, Araneo R, Brandão Faria J, He J, Petrache E, Pierno A, et al. On the role of shield wires in mitigating lightning-induced overvoltages in overhead lines-Part I: a critical review and a new analysis. IEEE Trans Power Deliv. 2023;38(1):335-344. Available from: https://ieeexplore.ieee.org/stamp/stamp.jsp?arnumber=9822977,22Moraes AAC, Silveira FH, Visacro S. Assessing the impact of DC bipole configuration on the lightning performance of an HVDC transmission line in terms of backflashover. Electr Power Syst Res. 2025;239:111174. Available from: doi:10.1016/j.epsr.2024.111174.,13-2513-25Wang X, He J, Yu Z, Zeng R. Influence of ground wire on the initiation of upward leader from 110 to 1000 kV AC phase line. Electr Power Syst Res. 2016;130:103-112.].
The Inga–Kolwezi ±500 kV HVDC scheme constitutes an unusually valuable field laboratory for understanding polarity-dependent lightning performance because its positive and negative poles are implemented as independent overhead lines. The supplied evidence establishes that lightning is a consequential reliability mechanism on the corridor, that both shielding failure and back-flashover occur, and that the two mechanisms occupy different current-amplitude regimes in the reported fault summary. The theoretical analysis further indicates that the DC operating voltage changes the interaction between a negative downward leader and the pole conductors: the negative pole is disadvantaged for direct negative-stroke flashover, while the positive pole can be disadvantaged for shielding failure and back-flashover. This interpretation is supported by recent 500 kV HVDC modelling showing that pole polarity and conductor position can substantially alter back-flashover performance. The principal scientific limitation is equally clear. Although the source states that a ten-year FALLS SAE analysis was used to establish comparable lightning exposure, the numerical pole-specific exposure totals and pole-specific fault counts are not contained in the supplied material. A formal statistical comparison of lightning-fault rates is therefore not justified from the available record alone. The strongest conclusion supported by the evidence is that a polarity-dependent difference is physically plausible and operationally important, but it remains to be quantified with the complete event-level dataset. Future work should integrate high-quality and intensity of lightning-location data, tower-footing measurements, exact pole-specific fault classification, and polarity-aware electro-geometric or leader-progression simulations. Such an integrated approach would allow the Inga–Kolwezi scheme to move from an illustrative comparison toward a statistically validated reliability model and could directly support targeted shielding optimisation, grounding improvement, inspection prioritisation and, where justified, selective surge-arrester deployment. The study therefore contributes not merely a comparison of two poles, but a framework for converting the unusual architecture of the Inga–Kolwezi link into a controlled empirical test of HVDC lightning-performance mechanisms.
Andreotti A, Araneo R, Brandão Faria J, He J, Petrache E, Pierno A, et al. On the role of shield wires in mitigating lightning-induced overvoltages in overhead lines-Part I: a critical review and a new analysis. IEEE Trans Power Deliv. 2023;38(1):335-344. Available from: https://ieeexplore.ieee.org/stamp/stamp.jsp?arnumber=9822977
Moraes AAC, Silveira FH, Visacro S. Assessing the impact of DC bipole configuration on the lightning performance of an HVDC transmission line in terms of backflashover. Electr Power Syst Res. 2025;239:111174. Available from: doi:10.1016/j.epsr.2024.111174.
He H, He J, Zhang D, Ding L, Jiang Z, Wang C, et al. Experimental study on lightning shielding performance of ±500 kV HVDC transmission lines. In: 2009 Asia-Pacific Power and Energy Engineering Conference; 2009. p. 1-7. Available from: https://ieeexplore.ieee.org/document/4918362
He J, Tu Y, Zeng R, Lee J. Numerical analysis model for shielding failure of transmission line under lightning stroke. IEEE Trans Power Deliv. 2005;20(2):815-822.
Dellera L, Garbagnati E. Lightning stroke simulation by means of the leader progression model. Part I: description of the model and evaluation of exposure of free-standing structures. IEEE Trans Power Deliv. 1990;5(4):2009-2022.
Dellera L, Garbagnati E. Lightning stroke simulation by means of the leader progression model. Part II: exposure and shielding failure evaluation of overhead lines with assessment of application graphs. IEEE Trans Power Deliv. 1990;5(4):2023-2029.
Vahidi B, Yahyaabadi M, Bank Tavakoli MR, Ahadi SM. Leader progression analysis model for shielding failure computation by using the charge simulation method. IEEE Trans Power Deliv. 2008;23(4):2201-2206.
Bank Tavakoli MR, Vahidi B. Transmission-lines shielding failure-rate calculation by means of 3-D leader progression models. IEEE Trans Power Deliv. 2011;26(2):507-516. Available from: https://ui.adsabs.harvard.edu/link_gateway/2011ITPD...26..507T/doi:10.1109/TPWRD.2010.2042183
Cuaran J, Becerra M, Roman F. Lightning attachment to UHV power transmission lines: effect of the phase voltage. IEEE Trans Power Deliv. 2019;34(2):729-738. Available from: https://www.scribd.com/document/952936440/Lightning-Attachment-to-UHV-Power-Transmission-Lines-Effect-of-the-Phase-Voltage
Han Y, Li L, Chen H, Lu Y. Influence of modeling methods on the calculated lightning surge overvoltages at a UHVDC converter station due to backflashover. IEEE Trans Power Deliv. 2012;27(3):1090-1095.
Silveira FH, Visacro S. Lightning performance of transmission lines: impact of current waveform and front-time on backflashover occurrence. IEEE Trans Power Deliv. 2019;34(6):2145-2151. Available from: https://www.researchgate.net/publication/330916025_Lightning_Performance_of_Transmission_Lines_Impact_of_Current_Waveform_and_Front-Time_on_Backflashover_Occurrence
Arafat E, Ghassemi M. Shielding failure analysis of extra high voltage unconventional transmission lines with increased power delivery capability. Sci Rep. 2025;15:29247. Available from:doi:10.1038/s41598-025-15276-2.
Wang X, He J, Yu Z, Zeng R. Influence of ground wire on the initiation of upward leader from 110 to 1000 kV AC phase line. Electr Power Syst Res. 2016;130:103-112.
Razzaghi R, Scatena M, Sheshyekani K, Paolone M, Rachidi F, Antonini G. Locating lightning strikes and flashovers along overhead power transmission lines using electromagnetic time reversal. Electr Power Syst Res. 2018;160:282-291. Available from: https://doi.org/10.1016/j.epsr.2018.03.012
Araneo R, Andreotti A, Brandão Faria J, Celozzi S, Assante D, Verolino L. Utilization of underbuilt shield wires to improve the lightning performance of overhead distribution lines hit by direct strokes. IEEE Trans Power Deliv. 2020;35(4):1656-1666. Available from: https://researchportal.ulisboa.pt/en/publications/utilization-of-underbuilt-shield-wires-to-improve-the-lightning-p/
Stracqualursi E, Araneo R, Brandão Faria J, Andreotti A. Protection of distribution overhead power lines against direct lightning strokes by means of underbuilt ground wires. Electr Power Syst Res. 2022;202:107571. Available from: https://www.sciencedirect.com/science/article/abs/pii/S0378779621005526
Xemard A, Sellin E, Tarafi R, Bertinato A, Verrax P. Lightning overvoltages on a DC transmission line, calculated based on measured bipolar lightning strokes. Electr Power Syst Res. 2021:107331. Available from: https://www.researchgate.net/publication/351562868_Lightning_overvoltages_on_a_DC_transmission_line_calculated_based_on_measured_bipolar_lightning_strokes
Cao J, Ding Y, Du Y, Chen M, Qi R. Design consideration of the shielding wire in 10 kV overhead distribution lines against lightning-induced overvoltage. IEEE Trans Power Deliv. 2021;36(5):3005-3013. Available from: https://www.researchgate.net/publication/344725514_Design_Consideration_of_the_Shielding_Wire_in_10_kV_Overhead_Distribution_Lines_Against_Lightning-Induced_Overvoltage
Datsios ZG, Mikropoulos PN, Tsovilis TE. Estimation of the minimum shielding failure flashover current for first and subsequent lightning strokes to overhead transmission lines. Electr Power Syst Res. 2014;113:141-150.
He J, Wang X, Yu Z, Zeng R. Statistical analysis on lightning performance of transmission lines in several regions of China. IEEE Trans Power Deliv. 2015;30(3):1543-1551.
Martínez JA, Castro-Aranda F. Lightning performance analysis of overhead transmission lines using the EMTP. IEEE Trans Power Deliv. 2005;20(3):2200-2210. Available from: https://www.researchgate.net/publication/3275183_Lightning_Performance_Analysis_of_Overhead_Transmission_Lines_Using_the_EMTP
Mizengi LM, Nzita AM. Comparative analysis of the use of lattice towers and polygonal monopoles in the SNEL SA power grid. Rev Congol Sci Technol. 2025;4(4):718-728. Available from: https://rcst.cd/index.php/rcst/en/article/view/611
Mohammadi R, Vahidi B, Rahiminejad A. Estimation of HVDC transmission lines shielding failure using LPM method and an adapted SLIM model. IET Sci Meas Technol. 2019;13(9):1345-1351. Available from: https://ietresearch.onlinelibrary.wiley.com/doi/10.1049/iet-smt.2018.5180
Munukutla K, Vittal V, Heydt GT, Chipman D, Keel B. A practical evaluation of surge arrester placement for transmission line lightning protection. IEEE Trans Power Deliv. 2010;25(3):1742-1748.
Wei B, Fu Z, Yuan H. Analysis of lightning shielding failure for 500-kV overhead transmission lines based on an improved leader progression model. IEEE Trans Power Deliv. 2009;24(3):1433-1440. Available from: https://www.researchgate.net/publication/224529924_Analysis_of_Lightning_Shielding_Failure_for_500-kV_Overhead_Transmission_Lines_Based_on_an_Improved_Leader_Progression_Model
Mizengi LM, Nzita AM. Comparison of the Lightning Performance Between the Poles of the Inga–Kolwezi ±500 Kv Hvdc Lines. IgMin Res. August 11, 2026; 4(8): 317-325. IgMin ID: igmin356; DOI:10.61927/igmin356; Available at: igmin.link/p356
1Regional School of Water (ERE) and Congo Basin Water Resources Research Center (CRREBaC), University of Kinshasa (UNIKIN), Kinshasa, Democratic Republic of the Congo
2President Joseph Kasa-Vubu University, Faculty of Engineering, Boma, Democratic Republic of the Congo
Address Correspondence: Léon Mwanda Mizengi, Regional School of Water (ERE) and Congo Basin Water Resources Research Center (CRREBaC), University of Kinshasa (UNIKIN), Kinshasa, Democratic Republic of the Congo, Email: leonmwanda@gmail.com
How to cite this article: Mizengi LM, Nzita AM. Comparison of the Lightning Performance Between the Poles of the Inga–Kolwezi ±500 Kv Hvdc Lines. IgMin Res. August 11, 2026; 4(8): 317-325. IgMin ID: igmin356; DOI:10.61927/igmin356; Available at: igmin.link/p356
Figure 8: Consolidated electro-geometric representation of a...
Table 1: Principal electrical and geometric parameters repo...
Table 2: Summary of Recorded Grid Incidents and Associated ...
Andreotti A, Araneo R, Brandão Faria J, He J, Petrache E, Pierno A, et al. On the role of shield wires in mitigating lightning-induced overvoltages in overhead lines-Part I: a critical review and a new analysis. IEEE Trans Power Deliv. 2023;38(1):335-344. Available from: https://ieeexplore.ieee.org/stamp/stamp.jsp?arnumber=9822977
Moraes AAC, Silveira FH, Visacro S. Assessing the impact of DC bipole configuration on the lightning performance of an HVDC transmission line in terms of backflashover. Electr Power Syst Res. 2025;239:111174. Available from: doi:10.1016/j.epsr.2024.111174.
He H, He J, Zhang D, Ding L, Jiang Z, Wang C, et al. Experimental study on lightning shielding performance of ±500 kV HVDC transmission lines. In: 2009 Asia-Pacific Power and Energy Engineering Conference; 2009. p. 1-7. Available from: https://ieeexplore.ieee.org/document/4918362
He J, Tu Y, Zeng R, Lee J. Numerical analysis model for shielding failure of transmission line under lightning stroke. IEEE Trans Power Deliv. 2005;20(2):815-822.
Dellera L, Garbagnati E. Lightning stroke simulation by means of the leader progression model. Part I: description of the model and evaluation of exposure of free-standing structures. IEEE Trans Power Deliv. 1990;5(4):2009-2022.
Dellera L, Garbagnati E. Lightning stroke simulation by means of the leader progression model. Part II: exposure and shielding failure evaluation of overhead lines with assessment of application graphs. IEEE Trans Power Deliv. 1990;5(4):2023-2029.
Vahidi B, Yahyaabadi M, Bank Tavakoli MR, Ahadi SM. Leader progression analysis model for shielding failure computation by using the charge simulation method. IEEE Trans Power Deliv. 2008;23(4):2201-2206.
Bank Tavakoli MR, Vahidi B. Transmission-lines shielding failure-rate calculation by means of 3-D leader progression models. IEEE Trans Power Deliv. 2011;26(2):507-516. Available from: https://ui.adsabs.harvard.edu/link_gateway/2011ITPD...26..507T/doi:10.1109/TPWRD.2010.2042183
Cuaran J, Becerra M, Roman F. Lightning attachment to UHV power transmission lines: effect of the phase voltage. IEEE Trans Power Deliv. 2019;34(2):729-738. Available from: https://www.scribd.com/document/952936440/Lightning-Attachment-to-UHV-Power-Transmission-Lines-Effect-of-the-Phase-Voltage
Han Y, Li L, Chen H, Lu Y. Influence of modeling methods on the calculated lightning surge overvoltages at a UHVDC converter station due to backflashover. IEEE Trans Power Deliv. 2012;27(3):1090-1095.
Silveira FH, Visacro S. Lightning performance of transmission lines: impact of current waveform and front-time on backflashover occurrence. IEEE Trans Power Deliv. 2019;34(6):2145-2151. Available from: https://www.researchgate.net/publication/330916025_Lightning_Performance_of_Transmission_Lines_Impact_of_Current_Waveform_and_Front-Time_on_Backflashover_Occurrence
Arafat E, Ghassemi M. Shielding failure analysis of extra high voltage unconventional transmission lines with increased power delivery capability. Sci Rep. 2025;15:29247. Available from:doi:10.1038/s41598-025-15276-2.
Wang X, He J, Yu Z, Zeng R. Influence of ground wire on the initiation of upward leader from 110 to 1000 kV AC phase line. Electr Power Syst Res. 2016;130:103-112.
Razzaghi R, Scatena M, Sheshyekani K, Paolone M, Rachidi F, Antonini G. Locating lightning strikes and flashovers along overhead power transmission lines using electromagnetic time reversal. Electr Power Syst Res. 2018;160:282-291. Available from: https://doi.org/10.1016/j.epsr.2018.03.012
Araneo R, Andreotti A, Brandão Faria J, Celozzi S, Assante D, Verolino L. Utilization of underbuilt shield wires to improve the lightning performance of overhead distribution lines hit by direct strokes. IEEE Trans Power Deliv. 2020;35(4):1656-1666. Available from: https://researchportal.ulisboa.pt/en/publications/utilization-of-underbuilt-shield-wires-to-improve-the-lightning-p/
Stracqualursi E, Araneo R, Brandão Faria J, Andreotti A. Protection of distribution overhead power lines against direct lightning strokes by means of underbuilt ground wires. Electr Power Syst Res. 2022;202:107571. Available from: https://www.sciencedirect.com/science/article/abs/pii/S0378779621005526
Xemard A, Sellin E, Tarafi R, Bertinato A, Verrax P. Lightning overvoltages on a DC transmission line, calculated based on measured bipolar lightning strokes. Electr Power Syst Res. 2021:107331. Available from: https://www.researchgate.net/publication/351562868_Lightning_overvoltages_on_a_DC_transmission_line_calculated_based_on_measured_bipolar_lightning_strokes
Cao J, Ding Y, Du Y, Chen M, Qi R. Design consideration of the shielding wire in 10 kV overhead distribution lines against lightning-induced overvoltage. IEEE Trans Power Deliv. 2021;36(5):3005-3013. Available from: https://www.researchgate.net/publication/344725514_Design_Consideration_of_the_Shielding_Wire_in_10_kV_Overhead_Distribution_Lines_Against_Lightning-Induced_Overvoltage
Datsios ZG, Mikropoulos PN, Tsovilis TE. Estimation of the minimum shielding failure flashover current for first and subsequent lightning strokes to overhead transmission lines. Electr Power Syst Res. 2014;113:141-150.
He J, Wang X, Yu Z, Zeng R. Statistical analysis on lightning performance of transmission lines in several regions of China. IEEE Trans Power Deliv. 2015;30(3):1543-1551.
Martínez JA, Castro-Aranda F. Lightning performance analysis of overhead transmission lines using the EMTP. IEEE Trans Power Deliv. 2005;20(3):2200-2210. Available from: https://www.researchgate.net/publication/3275183_Lightning_Performance_Analysis_of_Overhead_Transmission_Lines_Using_the_EMTP
Mizengi LM, Nzita AM. Comparative analysis of the use of lattice towers and polygonal monopoles in the SNEL SA power grid. Rev Congol Sci Technol. 2025;4(4):718-728. Available from: https://rcst.cd/index.php/rcst/en/article/view/611
Mohammadi R, Vahidi B, Rahiminejad A. Estimation of HVDC transmission lines shielding failure using LPM method and an adapted SLIM model. IET Sci Meas Technol. 2019;13(9):1345-1351. Available from: https://ietresearch.onlinelibrary.wiley.com/doi/10.1049/iet-smt.2018.5180
Munukutla K, Vittal V, Heydt GT, Chipman D, Keel B. A practical evaluation of surge arrester placement for transmission line lightning protection. IEEE Trans Power Deliv. 2010;25(3):1742-1748.
Wei B, Fu Z, Yuan H. Analysis of lightning shielding failure for 500-kV overhead transmission lines based on an improved leader progression model. IEEE Trans Power Deliv. 2009;24(3):1433-1440. Available from: https://www.researchgate.net/publication/224529924_Analysis_of_Lightning_Shielding_Failure_for_500-kV_Overhead_Transmission_Lines_Based_on_an_Improved_Leader_Progression_Model






 Scan and get link