IGMIN: We're glad you're here. Please click 'create a new query' if you are a new visitor to our website and need further information from us.
If you are already a member of our network and need to keep track of any developments regarding a question you have already submitted, click 'take me to my Query.'
Welcome to IgMin Research – an Open Access journal uniting Biology, Medicine, and Engineering. We’re dedicated to advancing global knowledge and fostering collaboration across scientific fields.
At IgMin Research, we bridge the frontiers of Biology, Medicine, and Engineering to foster interdisciplinary innovation. Our expanded scope now embraces a wide spectrum of scientific disciplines, empowering global researchers to explore, contribute, and collaborate through open access.
Welcome to IgMin, a leading platform dedicated to enhancing knowledge dissemination and professional growth across multiple fields of science, technology, and the humanities. We believe in the power of open access, collaboration, and innovation. Our goal is to provide individuals and organizations with the tools they need to succeed in the global knowledge economy.
IgMin Publications Inc., Suite 102, West Hartford, CT - 06110, USA
Predicting the direction of stock market movements is a challenging task due to its fuzzy, chaotic, volatile, nonlinear, and complex nature. However, with advancements in artificial intelligence, abundant data availability, and improved computational capabilities, creating robust models capable of accurately predicting stock market movement is now feasible. This study aims to develop a predictive model using news headlines to forecast the direction of stock market movements. It conducts a comparative analysis of four supervised classification deep learning models —long short-term memory (LSTM), gated recurrent unit (GRU), bidirectional long short-term memory (BiLSTM), and bidirectional gated recurrent unit (BiGRU)—to predict the next day’s movement direction of the close price of the Nepal Stock Exchange (NEPSE) index. Sentiment scores from the news headlines are computed using the Valence Aware Dictionary for Sentiment Reasoning (VADER) and the TextBlob sentiment analyzer. The models’ performance is evaluated based on sensitivity, specificity, accuracy, and the area under the receiver operating characteristic (ROC) curve (AUC). Experimental results indicate that all four models perform similarly when using sentiment scores from either VADER or TextBlob. Additionally, GRU and BiGRU models show consistent performance across both sentiment analyzers. However, LSTM and BiLSTM perform slightly better with TextBlob sentiment scores compared to those from VADER. These findings are further validated through statistical tests.
The stock market enables the buying and selling of ownership shares in companies commonly known as stocks, allowing investors to gain profits when a company’s value increases and incur losses when it declines. The evolution of the stock market has been remarkable, progressing from handwritten transactions in coffee shops to today’s sophisticated digital platforms that provide instant access to global markets. This technological advancement promotes economic growth by fostering competition and innovation across sectors such as business, education, and the labor market [1,2]. However, selecting the right stocks at the right time remains a significant challenge, as a wide range of dynamic factors influences stock prices. The inherently nonlinear, volatile, fuzzy, noisy, non-parametric, and deterministically chaotic nature of stock behavior [3–6] adds to this complexity. Incorporating reliable sources of public sentiment into stock price prediction models can improve investment decisions and help mitigate the uncertainties of the market.
Several schools of thought have been employed to predict the direction of stock price movements. Traditionally, the first school is grounded in the Efficient Market Hypothesis (EMH), which emphasizes the significant role of historical stock data in forecasting future price movements [7]. In contrast, the Random Walk Theory [8] argues that a stock’s current price already reflects all relevant information and that any price changes are due to the arrival of new information or random noise. The second school centers on statistical modeling, which seeks to predict future price movements based on the relationships between past and present data [9–12]. However, many of these models assume linear relationships between variables, despite the fact that stock market data often exhibit nonlinear patterns. The third, and most advanced, school has emerged alongside technological advancements, increased computational power, and the development of rule-based artificial intelligence algorithms [13–18]. These AI-driven models are particularly effective at capturing the nonlinear behavior inherent in stock market data.
With rare exceptions, most stock price prediction models—regardless of paradigm—rely primarily on structured numerical data [19–22]. However, over the past decade, the trajectory of the stock market has been increasingly shaped by information disseminated through digital media platforms such as Facebook, Twitter, and financial forums[23–25]. These platforms contribute to greater market volatility, often reflecting the psychological tendencies of individual investors. When human sentiment is considered, the market landscape becomes more complex and multifaceted. For example, on January 27, 2023, the Nepalese Supreme Court’s decision to invalidate the election of Rabi Lamichhane—former Deputy Prime Minister and Home Minister—led to a significant shift in investor sentiment, causing the Nepal Stock Exchange (NEPSE) index to fall by 88.67 points, or 4.06%, between January 29 and February 2 (The Himalayan). Similarly, a tweet by Elon Musk on March 24, 2021, announcing that Tesla would accept Bitcoin as payment, led to a 5.2% surge in Bitcoin’s price (Bloomberg.com). In another example, President Donald Trump’s tweet on January 5, 2017, threatening heavy taxes on Toyota for manufacturing cars in Mexico, resulted in a sharp decline in Toyota’s stock price [26,27]. Likewise, on August 1, 2019, a series of Trump’s tweets regarding tariffs on Chinese goods triggered a market drop, with the Dow Jones Industrial Average falling by 98.41 points and the S&P 500 losing 0.7% (CNBC). More recently, Trump’s tweet about imposing a 50% tariff on European Union (EU) imports and a 25% tariff on iPhones not made in the U.S. caused notable market disruption: the Dow declined by 0.6%, the S&P 500 by 0.7%, the Nasdaq by 1%, and Apple’s stock dropped by approximately 3% (Advisorpedia).
Numerous research studies have been published utilizing a range of machine learning and deep learning models, often accompanied by optimistic claims regarding the accuracy and robustness of their approaches [28–34]. However, these studies differ significantly in their implementation methods, operational frameworks, underlying assumptions, feature sets, and data sources, making an objective comparison between works—even those using the same model for predicting stock index price movements—largely unfeasible. Moreover, there remains a notable gap in the literature regarding a comprehensive comparative analysis focused solely on predicting stock price movements using unstructured data, such as news headlines or social media posts.
In this study, long short-term memory (LSTM), gated recurrent unit (GRU), bidirectional long short-term memory (BiLSTM), and bidirectional gated recurrent unit (BiGRU) deep learning models are evaluated within a standardized framework under consistent conditions, using only financial news headlines as input. Although access to financial news from developing countries like Nepal is limited to a few media sources, the consistency of sentiment-driven market reactions over specific periods supports the rationale for selecting data from developing nations, aligning well with the study’s objectives.
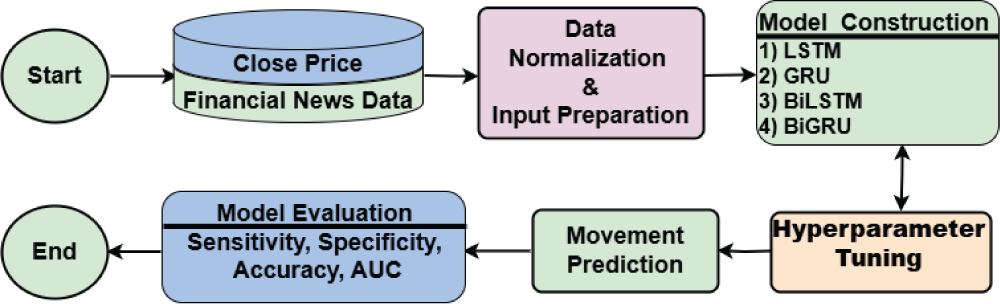
The overall vision for achieving the stated goal is illustrated in the schematic diagram shown in Figure 1. The proposed study utilizes closing price data and financial news headlines to construct the predictive model. The movement direction of the closing price and the sentiment scores of the news headlines are first calculated, after which the data are normalized using the min-max technique. LSTM, GRU, BiLSTM, and BiGRU models are then developed using the financial news data as input. After optimizing the hyperparameters, the final model predicts the direction of the stock market index’s closing price for the following day. The model’s accuracy and robustness are subsequently evaluated using four performance metrics: sensitivity, specificity, accuracy, and the area under the receiver operating characteristic (ROC) curve (AUC).
Figure 1: Schematic diagram of the proposed research framework.
The primary contributions of this research are as follows: (a) Addressing the central question—under uniform conditions, which model (LSTM, GRU, BiLSTM, or BiGRU) is best suited for predicting the direction of stock price movement using news headlines as the sole input? (b) Identifying the sentiment analyzer that aligns most effectively with the deep learning models; and (c) conducting a series of statistical hypothesis tests to ensure the reliability of the experimental results.
The remainder of this paper is organized as follows: Section 2 reviews related work in the field. Section 3 offers a brief overview of the deep learning models employed. Standard evaluation metrics are introduced in Section 4. Section 5 details the experimental design, including data preprocessing and partitioning, hyperparameter tuning, model comparison, and statistical analysis. Section 6 discusses the ethical considerations and implications of the study. The discussion in Section 7 analyzes the reasons behind the relatively low predictive accuracy of the deep learning models on NEPSE stock movements and highlights the implications for future AI applications in financial markets. Finally, Section 8 presents the conclusion and outlines future work, followed by the acknowledgments and references.
In recent years, research on stock price movements across various financial sectors has grown significantly. Both academic scholars and industry practitioners have invested substantial effort in forecasting future movements of stock market indices or their returns, as well as in developing financial trading strategies to capitalize on these forecasts [20,35]. This section reviews prior studies that have employed machine learning algorithms to predict stock price movements.
An increasing number of studies have highlighted the effectiveness of machine learning algorithms in predicting stock price movements across international financial markets. Wang [19] compared PCA-SVM—a hybrid model that integrates principal component analysis (PCA) with support vector machine (SVM)—against four other machine learning algorithms: SVM, artificial neural network (ANN), random walk (RW), and PCA-ANN. Using fundamental data, the study aimed to predict market index and stock price directions. The empirical analysis was conducted on the Korean Composite Stock Price Index (KOSPI), the Hang Seng Index (HSI), and their constituent stocks, revealing notably high hit ratios for PCA-SVM in forecasting individual stock movements. Similarly, Kara et al. [20] evaluated ANN and SVM models for predicting the movement direction of the Istanbul Stock Exchange National 100 Index, with ANN demonstrating significantly better average performance than SVM. Meanwhile, Khoa and Huynh [21] compared SVM, ANN, and logistic regression models in predicting the VNI30 index, identifying SVM as the most effective model. Additionally, Huang et al. [36] assessed the performance of SVM in forecasting the movement of the NIKKEI 225 index, concluding that SVM outperformed other classification techniques. Furthermore, Ballings et al. [37] compared ensemble methods with single classifier models for stock price prediction, with random forest emerging as the top-performing algorithm. Collectively, these studies highlight the strong predictive capabilities of various machine learning techniques in forecasting stock market movements across different indices and markets.
Recent research has increasingly focused on developing hybrid and integrated machine learning models to improve the accuracy of stock market predictions. Ismail et al. [22] introduced a hybrid approach that combined logistic regression, artificial neural networks, support vector machines, and random forest with persistent homology to enhance prediction performance, focusing on three stocks from the Kuala Lumpur Stock Exchange. Their findings showed that incorporating persistent homology significantly improved prediction accuracy. Similarly, Ren et al. [38] integrated sentiment analysis into an SVM-based model, achieving a notable improvement in forecasting accuracy for the Shanghai Stock Exchange (SSE) 50 Index. Qiu and Song [39] explored a hybrid model that combined an optimized artificial neural network with genetic algorithms for forecasting the Nikkei 225 index, demonstrating that careful input variable selection enhanced forecast accuracy. Meanwhile, Imandoust and Bolandraftar [40] compared decision tree, random forest, and naïve Bayes models for predicting movement direction in the Tehran Stock Exchange index, finding that the decision tree outperformed the other approaches. Additionally, Chandola et al. [41] proposed a hybrid deep learning model, Word2Vec-LSTM, which integrates Word2Vec with long short-term memory (LSTM) networks to forecast stock market prices using financial time series data and news headlines. Their results demonstrated improved accuracy compared to earlier models, underscoring the temporal influence of news headlines on investor behavior.
Numerous studies have explored a wide range of machine learning and deep learning models to enhance the accuracy of stock price movement prediction across various markets. Ampomah et al. [42] evaluated several tree-based ensemble machine learning models—including random forest, extreme gradient boosting, bagging classifier, AdaBoost, extra trees, and a voting classifier—using data from eight different stocks listed on the NYSE, NASDAQ, and NSE. They employed forty technical indicators categorized into momentum, volume, and price transform as input features and assessed model performance using Kendall’s W test of concordance. Their results indicated that the extra trees model outperformed the others. In a related effort, Fazlija et al. [43] aimed to predict price trends of the S&P 500 index using financial news headlines and moving averages. By utilizing pre-trained transformer networks to generate sentiment scores and applying a random forest classifier, they found that news headlines were the most significant predictor of stock price movements. Similarly, Rustam et al. [44] compared support vector machines (SVM) and fuzzy kernel C-means (FKCM) for predicting movements in the Indonesian stock market, concluding that SVM with trend-based technical indicators achieved the best performance. Kim et al. [45] investigated the use of effective transfer entropy (ETE) as a market explanatory variable and demonstrated its value in enhancing predictive performance across various models, including logistic regression, multilayer perceptron, random forest, extreme gradient boosting, and long short-term memory (LSTM) networks. Furthermore, Long et al. [46] introduced a deep stock trend prediction neural network (DSPNN), which utilized desensitized transaction records and public market data. Their model outperformed random forest, AdaBoost, and LSTM in forecasting stock price trends.
Advancements in deep learning have led to the development of sophisticated hybrid and attention-based models for improving the accuracy of stock price movement prediction. Zhang et al. [47] developed a convolutional neural network model called FA-CNN, which integrates a deep factorization machine and an attention mechanism to enhance feature learning. Their model outperformed several alternatives, including long short-term memory (LSTM), a hybrid of LSTM and deep factorization machines (DeepFM), an attention-based CNN (ATT-CNN), and a multi-filter neural network (MFNN). Similarly, Zhao and Yang [17] proposed SA-DLSTM, a hybrid model that combines an emotion-enhanced convolutional neural network (ECNN), a denoising autoencoder (DAE), and LSTM. Applied to the Hang Seng Index, SA-DLSTM achieved higher prediction accuracy than models such as the wavelet PCA neural network (WPCA-NN), wavelet neural network (WNN), and a hybrid random forest and LSBoost model (LS_RF). In another study, Zhang et al. [48] introduced a DBN-LSTM model, which combines deep belief networks and LSTM, and demonstrated superior performance over multilayer perceptron (MLP) and traditional LSTM on data from the Shanghai and Shenzhen Stock Exchanges. Furthermore, Kumar et al. [49] proposed a generative adversarial network (GAN)-based approach for stock market forecasting, which outperformed LSTM on selected company data. Additionally, Gao et al. [50] assessed the effectiveness of MLP, LSTM, CNN, and an Uncertainty-aware Attention (UA) model across various market types, finding UA to be the most effective, particularly in developed financial markets.
Incorporating additional data sources such as financial news sentiment and technical indicators has been shown to enhance the performance of deep learning models in stock price prediction. Shahi et al. [51] investigated whether the inclusion of financial news sentiment could improve the predictive accuracy of LSTM and GRU models. Using historical stock data from Nepal’s Agricultural Development Bank Limited (ADBL) along with financial news headlines, they found that incorporating sentiment information significantly enhanced the performance of both models. Similarly, Kunwar and Khati [52] conducted a comparative analysis using LSTM neural networks to assess the effectiveness of technical indicators in stock market prediction. Their results showed that combining technical indicators with fundamental and sentiment data produced better predictive performance than relying on fundamental and sentiment data alone.
Sentiment analysis has become a valuable tool in understanding the influence of news and public opinion on stock market behavior and other real-world events. Prasad and Kadariya [53] examined the effects of global diversification by comparing the behaviors of the Nepalese and U.S. stock markets. Using descriptive and causal-comparative research designs along with content analysis of newspaper headlines categorized as ’bad,’ ’good,’ or ’informational,’ their regression analysis revealed that ’bad’ news had the strongest impact, significantly reducing stock returns, while ’good’ news increased returns and ’informational’ news had inconsistent effects. Similarly, Illia et al. [54] analyzed public sentiment on Twitter during the vaccine data leak related to the PeduliLindung app, using TextBlob and VADER for sentiment classification. They found that VADER performed better due to its lexicon tailored to social media language. In another large-scale sentiment analysis study, Abiola et al. [55] examined over one million tweets tagged with ’COVID-19,’ using a Twitter tokenizer, TextBlob, VADER, and Latent Dirichlet Allocation (LDA) for topic modeling. Their findings showed differing sentiment distributions: VADER detected 39.8% positive, 31.3% neutral, and 28.9% negative sentiments, while TextBlob identified 46.0% neutral, 36.7% positive, and 17.3% negative. Additionally, Nemes and Kiss [56] conducted sentiment analysis on company news headlines using BERT, VADER, TextBlob, and a Recurrent Neural Network (RNN). They found BERT and RNN to be the most accurate and demonstrated how emotional sentiment aligned with changes in stock values, with each model capturing different levels of sentiment impact.
In summary, the extensive range of methodologies and models explored in the cited studies reflects the ongoing pursuit of refined and accurate stock market prediction. From hybrid machine learning approaches to sentiment analysis integration and deep learning architectures, the diverse strategies underscore the multifaceted nature of forecasting in financial markets, offering insights and advancements that pave the way for more effective investment decision-making in the future.
Long Short-Term Memory (LSTM) networks are a widely used type of recurrent neural network (RNN) for time-series forecasting [57]. Although standard RNNs can retain information more effectively than traditional feed-forward networks, they struggle to capture long-range dependencies due to the vanishing-gradient problem [58]. LSTM addresses this limitation through memory cells that mitigate gradient decay. Its architecture includes an input layer, a hidden layer, a cell state, and an output layer [59–61]. The cell state is the core element, carrying information linearly through the sequence to preserve it over time. A system of gates regulates this cell state, either discarding or updating information as needed. These gates utilize sigmoid activations, hyperbolic tangent functions, and element-wise multiplication to regulate the flow of information throughout the network. A more detailed description of the LSTM unit’s internal structure is provided in [3].
Gated Recurrent Unit (GRU)
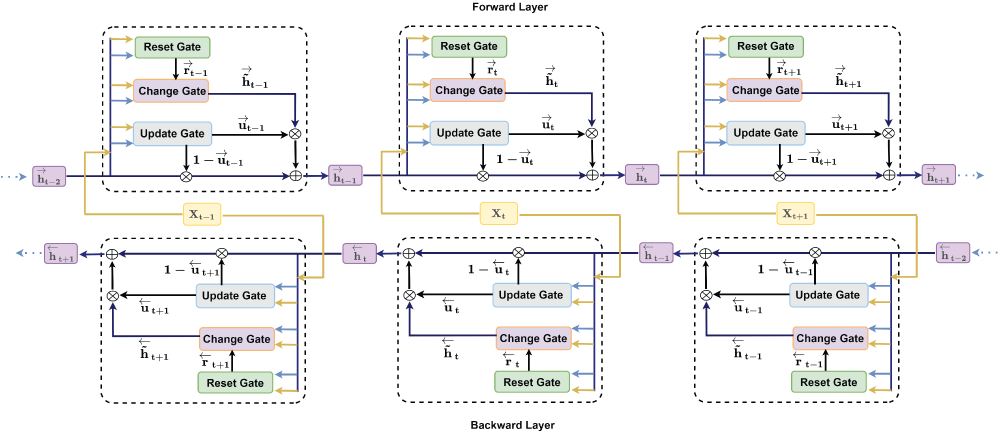
The Gated Recurrent Unit (GRU) is a simplified version of the LSTM architecture, combining the short-term state (ht) and long-term state (ct) of LSTM into a single vector ht. Unlike LSTM’s four gating mechanisms, GRU employs only three: the reset gate, the change gate, and the update gate. The update gate serves the combined role of LSTM’s forget and input gates, allowing one mechanism to determine which information to discard and which to retain. A comprehensive explanation of the GRU unit’s internal design is provided in [62].
Bidirectional LSTM (BiLSTM)
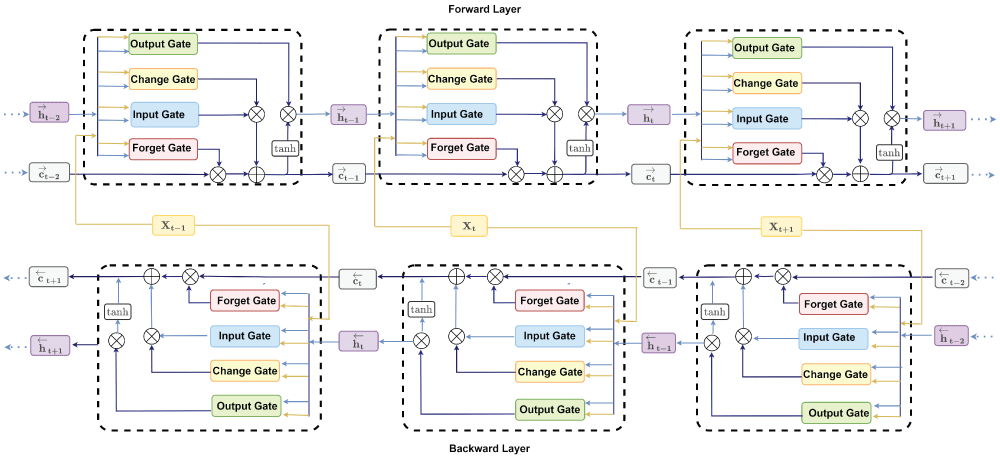
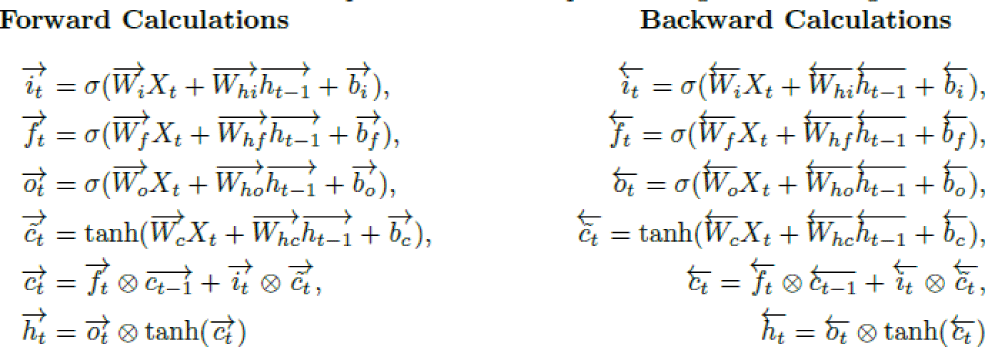
The Bidirectional Long Short-Term Memory (BiLSTM) network integrates the principles of standard LSTM and a traditional bidirectional RNN. As illustrated in Figure 2, the model processes sequential data across three time steps —t-1, t, and t+1. It consists of two distinct LSTM hidden layers: one operating in the forward direction (upper portion of the figure) and the other in the backward direction (lower portion) [63–65]. Four gates for each BiLSTM cell of both hidden layers —output (Ot), change (c˜t), input (it), and forget (ft) —are shown with their respective operations at time t.
Figure 2: BiLSTM architecture.
Given n observations with k features {z1,z2,...,zn}, where each zi ∈ Rk×1, i = 1,2,..., n, let Xt ∈ Rk×m represent the input at time t. Here, m denotes the number of past observations (time steps) used to forecast the next target value. In the BiLSTM framework, the forward memory cell ct is updated through three gates: the input gate, forget gate ft, and change gate c˜t. The forward hidden state ht is then computed using the output gate ot along with ct. An analogous process takes place in the backward direction. Note that X1 is the initial input for the forward computation, whereas Xn-m+1 is the starting input for the backward direction. Finally, the hidden state Ht of the BiLSTM model is obtainedby concatenating the forward hidden state ht and the backward hidden state ht. At time t, the respective gates and layers for forward and backward operations are computed using the following functions:
Where s and tanh represent the sigmoid and hyperbolic tangent functions, respectively. The operator ∈ is the element-wise product, Wi, Wf, Wo,Wc ∈ Rd×k, Whi, Whf, Who, Whc ∈ Rd×d are weight matrices. The bias vectors bi, bf, bo, bc ∈ Rd×1 are added to each column of the feature matrix.
is the forward hidden state
is the backward hidden state of BiLSTM. Moreover, k and d constitute and ht ?R
The number of features and the hidden size, respectively [66–71]. The final output yt of the BiLSTM cell at time t is given by:
yt = WHHt + bH
where WH ∈ Rd×2d, Ht ∈ R2d×1, and bh ∈ Rd×1.
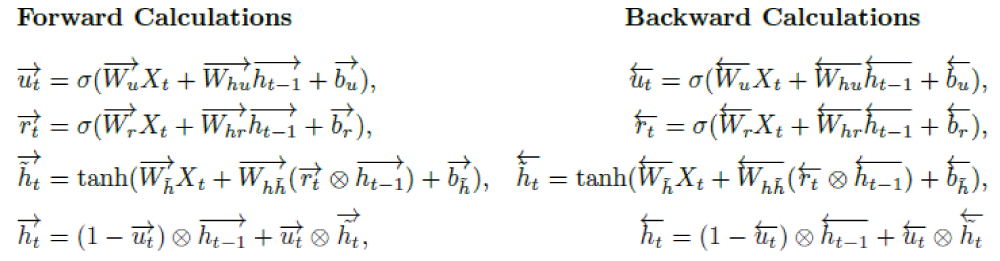
Bidirectional GRU (BiGRU)
BiGRU is an extended version of GRU and was first proposed by Schuster and Paliwal in 1997 [72]. It is equipped with two separate hidden GRU layers, one for the forward direction (top part in Figure 3) and the other for the backward direction (bottom part in Figure 3). Three gates for each BiGRU cell of both hidden layers —reset (rt), change (h˜ t), and update (ut) —are shown with their operations at time t in Figure 3.
Figure 3: BiGRU architecture.
BiGRU takes the input Xt and the hidden state ht-1 from the previous time step at time t. It outputs a new hidden state ht and forwards it again to the next time step [73]. There is a similar calculation for the backward direction as well. Finally, the hidden state Ht of the BiGRU model is obtained by concatenating the forward hidden states
state ht and the backward hidden state
. At time t, the respective gates and layers for forward and backward operations are computed using the following functions:
Where s and tanh represent the sigmoid and hyperbolic tangent functions, respectively, the operator ∈ is the element-wise product. Moreover, Wu, Wr, Wh˜ ∈ Rd×k, and Whu, Whr, Wh˜ ∈ Rd×d are weight matrices, and bu, br, bh˜ ∈ Rd×1 are bias vectors which are added to each column of the corresponding matrix. Finally, k and d are the number of features and the hidden size, respectively [71]. The output (yt) of the tth BiGRU cell is given by:
NEPSE movement direction prediction from the constructed model is assessed through the four different performance metrics: sensitivity, specificity, accuracy, and area under the receiver operating characteristic (ROC) curve (AUC). These metrics help determine the best model in terms of accuracy and reliability [37,42,74–76]. The elements of the confusion matrix are utilized to find three important metrics: sensitivity, specificity, and accuracy. The analytical form of a confusion matrix is defined in Table 1.
Table 1: Confusion Matrix
Predicted Negative
Predicted Positive
Actual Negative
True Negative (TN)
False Positive (FP)
Actual Positive
False Negative (FN)
True Positive (TP)
Sensitivity represents the proportion of actual positive cases (NEPSE moving upward) that are correctly predicted as positive. Specificity represents the proportion of actual negative cases (NEPSE moving downward) that are correctly predicted as negative. Accuracy represents the proportion of cases that are predicted accurately (predicted positive for NEPSE moving upward and predicted negative for NEPSE moving downward). The analytical form of these metrics is defined by
(1)
(2)
(3)
Sensitivity and specificity are inversely proportional to each other. The receiver operating characteristic (ROC) curve is commonly used to characterize the sensitivity/specificity trade-offs for a binary classifier. The ROC curve is obtained by plotting the false positive rate (1-specificity) on the x-axis against the sensitivity on the y-axis at various threshold settings. Area under the ROC curve (AUC) is one of the most important metrics to measure the performance of the model. Its value lies between 0 and 1. A model is said to be excellent if its AUC is close to 1. The higher the AUC, the better the model, and vice versa. The best model is determined by prioritizing statistics in the following order: accuracy (priority), AUC (second priority), sensitivity, and specificity (equal and lower priority compared to the other two).
This study compares the performance of LSTM, GRU, BiLSTM, and BiGRU models in NEPSE movement direction prediction. The experiment is divided into six phases: (1) setting up the environment, (2) data description and input preparation, (3) Model construction and hyperparameter tuning, (4) identifying the best-performing models from respective architectures, (5) identifying the overall best model, and (6) statistical analysis.
Setting up the environment
Table 2 summarizes the computational framework of the experiments. The experiments were conducted using the Python 3.6.0 programming environment, with the TensorFlow 2.x and Keras 2.x APIs. Also, the Machine configuration and employed architecture used in the experiments are listed in the Table.
Table 2: Computing environmental setup
Machine Configuration
Google Colab with NVIDIA-SMI 495.44 GPU
Environment
Python 3.6.0, TensorFlow, and Keras APIs
Architecture
LSTM, GRU, BiLSTM, BiGRU
Data description and input preparation
The Nepal Stock Exchange (NEPSE) serves as the primary stock market in Nepal, facilitating the trading of securities and promoting investment opportunities within the country. Established in 1993 under the Securities Exchange Act, NEPSE plays a crucial role in fostering economic growth and development by providing a platform for companies to raise capital and for investors to participate in the financial markets. As the sole stock exchange in Nepal, NEPSE oversees the listing and trading of various financial instruments, including stocks, bonds, and mutual funds, contributing to the country’s financial infrastructure and market stability [77,78].
The closing price of the NEPSE index and the financial news headlines from January 1, 2017, to December 31, 2024, are scraped from the portal Share Sansar (www.sharesansar.com) using a web crawler. Share Sansar is a prominent online platform in Nepal dedicated to stock market news and analysis, providing a wealth of data, including stock prices, market trends, company financials, and news articles.
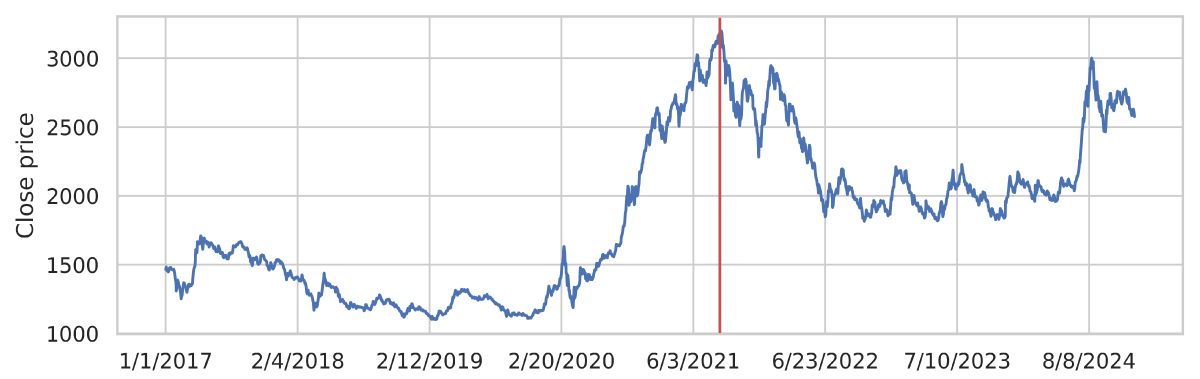
This study aims to perform a comparative analysis of the performance of deep learning models in predicting the next day’s movement direction of the NEPSE index, the sole stock exchange of Nepal. Figure 4 illustrates the original time series data of the index closing prices from January 1, 2017, to December 31, 2024. The time span covers both bear and bull markets. The vertical dotted line in the graph indicates the maximum closing price, which occurred on September 9, 2021, just before the COVID-19 spread in Nepal. The time span is selected intentionally to train the model to capture the patterns in both normal and volatile market situations and then test its performance in similar environments. We define the direction, a dichotomous variable, using the following equation:
Figure 4: NEPSE closing price between January 1, 2017, to December 31, 2024.
(4)
Where Closet represents the closing price of the current day, while Closet+1 represents the closing price of the following day. Over the eight years from the beginning of 2017 through the end of 2024, there were 861 instances of the NEPSE moving upward (positive direction) and 976 instances of it moving downward (negative direction).
Before computing sentiment scores, raw text data should undergo preprocessing steps such as removing stop words, handling punctuation, and stemming or lemmatization to enhance the accuracy and effectiveness of sentiment analysis algorithms. We cleaned up the raw text data (news headlines) using the functions split(), fix(), join(), word_tokenize(), lower(), and string.punctuation(), stopwords. words('english'), pos_tag(), and lemmatize() sequentially that are extracted from the nltk library [79].
Now, the text data is ready (clean) for sentiment analysis. The Valence Aware Dictionary and Sentiment Reasoning (VADER) [80] and TextBlob [81] are the most common and reliable tools to compute the sentiment score [82–84]. VADER is a pretrained model that analyzes people’s opinions, sentiments, evaluations, attitudes, and emotions via computational treatment regarding polarity (positive/negative) and intensity (strength) in text. It relies on an English dictionary that maps lexical features to their semantic orientation as positive or negative [85]. TextBlob is a powerful and user-friendly Python library for natural language processing (NLP). Built on the NLTK [79] and Pattern libraries, TextBlob simplifies the complexities of working with textual data by providing a simple API for common NLP tasks. It offers a range of functionalities, including part-of-speech tagging, noun phrase extraction, sentiment analysis, classification, translation, and more. TextBlob’s strength lies in its ease of use, making it an excellent choice for beginners and researchers alike. With its straightforward syntax and extensive documentation, TextBlob enables developers to quickly implement NLP features in their applications without the need for extensive background knowledge in linguistics or machine learning.
Both tools (VADER and TextBlob) have their strengths and weaknesses, and the choice between them depends on factors such as the specific use case, the type of text data being analyzed, and the desired level of accuracy and flexibility [86]. After preprocessing, the data is fed into TextBlob and VADER to determine its corresponding sentiment scores. We label the sentiment score from TextBlob as TextBlob sentiment data and the sentiment score from VADER as VADER sentiment data. This labeling will help readers easily identify and understand the source of the data.
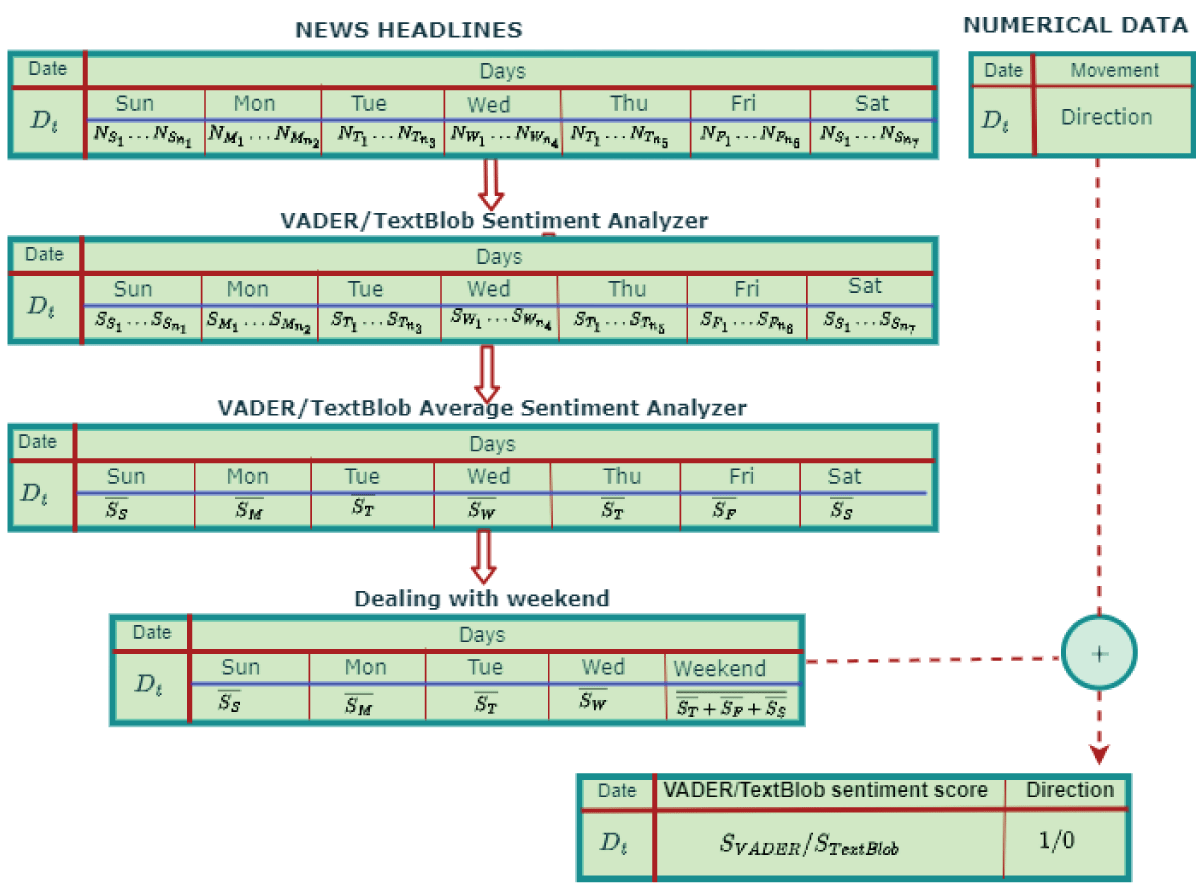
The news data contains a large number of news items published in a single day. So, we computed the average news score for each day. The NEPSE runs from Sunday to Thursday, but financial news headlines are published seven days a week. We believe that news on Thursday and the weekend has an impact on the stock price on Sunday (the first trading day of next week). Therefore, we computed the mean sentiment score of Thursday, Friday, and Saturday, which we use to predict the movement direction of the NEPSE index for Sunday. Finally, the sentiment scores for the financial news data are aligned with the movement direction of the index date, as shown in Figure 5.
Figure 5: Concatenation of movement direction and news sentiment score.
The range of values for input features can vary significantly, negatively impacting our results’ accuracy. Thus, we have implemented a min-max normalization technique that scales each feature to the [0,1] range. The mathematical formulation of the normalization procedure is defined as:
(5)
where x is the original value, and z is the normalized value of the input variable. Similarly, xmin< and xmax are the minimum and the maximum values, respectively. The normalized datasets are sequentially divided into three subsets: training, validation, and test. Table 3 outlines the time range and the corresponding number of samples for each subset. The training set spans from January 1, 2017, to November 9, 2021; the validation set covers November 11, 2021, to May 22, 2023; and the test set includes data from May 23, 2023, to December 31, 2024.
Table 3: Overall distribution of training, validation, and test data
Data
Dates (mm/dd/yyyy)
No. of Samples
Complete
01/01/2017 – 12/31/2024
1837
Training
01/01/2017 – 11/09/2021
1102
Validation
11/11/2021 – 05/22/2023
367
Test
05/23/2023 – 12/31/2024
368
The datasets (training, validation, and test) are in the form of 2D arrays (number of observations, number of features). However, our model architecture requires 3D input data. Thus, the data are converted into 3D arrays (number of observations, time step, number of features) by incorporating the time step before feeding them into the model.
Model construction and hyperparameter tuning
We construct deep learning models in which each model consists of an input layer, a single LSTM, GRU, BiLSTM, or BiGRU hidden layer, and a dense output layer with sigmoid activation. A single hidden layer is used due to the relatively small size of our dataset. To mitigate the risk of overfitting, we apply a 5% dropout rate and implement early stopping criteria, which allow training to continue for a large number of epochs but stop the process when performance on the validation set no longer improves [87].
After constructing each model, we perform hyperparameter tuning to identify the optimal combination of the hyperparameters. The search space includes five optimizers (Adam, SGD, RMSprop, Nadam, and Adagrad), three learning rates (0.1, 0.01, and 0.001), three batch sizes (4, 8, and 16), four time steps (5, 10, 15, and 20), and five neuron sizes (5, 10, 25, 50, and 100) for the hidden layer. This results in 5*3*3*4*5=900 possible configurations for each model.
To account for the stochastic nature of neural network training, we run ten independent replicates for each configuration and compute the average performance scores. Model selection is based on the configuration that yields the highest average accuracy on the validation dataset. In total, we evaluate 3600 model instances (4 architectures × 900 combinations each) during the hyperparameter tuning process. The optimal hyperparameter settings for each model architecture are reported in Table 4 for VADER sentiment data and in Table 5 for TextBlob data.
Table 4: List of the best hyperparameters for LSTM, GRU, BiLSTM, and BiGRU models for VADER sentiment data.
Model
Time Step
No. of Neurons
Learning Rate
Optimizer
Batch Size
Best Validation Accuracy
LSTM
5
25
0.01
Adam
16
0.6205
10
5
0.01
SGD
8
0.6124
15
100
0.01
RMSprop
4
0.6125
20
50
0.001
RMSprop
8
0.6069
GRU
5
10
0.01
RMSprop
4
0.6150
10
25
0.001
SGD
8
0.6039
15
10
0.01
Nadam
4
0.6125
20
10
0.1
Adam
8
0.6012
BiLSTM
5
25
0.01
RMSprop
8
0.6205
10
10
0.1
Adam
8
0.6208
15
50
0.001
Adam
16
0.6125
20
5
0.1
RMSprop
4
0.6098
BiGRU
5
5
0.01
RMSprop
16
0.6150
10
10
0.1
SGD
8
0.6264
15
5
0.001
RMSprop
8
0.6154
20
50
0.01
Adam
8
0.6069
Table 5: List of the best hyperparameters for LSTM, GRU, BiLSTM, and BiGRU models for TextBlob sentiment data.
Model
Time Step
No. of Neurons
Learning Rate
Optimizer
Batch Size
Best Validation Accuracy
LSTM
5
5
0.01
Adagrad
16
0.6205
10
5
0.01
Adagrad
4
0.6124
15
5
0.001
Adam
16
0.6097
20
10
0.001
Adam
8
0.6098
GRU
5
5
0.001
Adagrad
16
0.6205
10
50
0.01
Adam
8
0.6180
15
100
0.1
Nadam
8
0.6040
20
100
0.01
Nadam
8
0.6040
BiLSTM
5
5
0.01
RMSprop
8
0.6177
10
10
0.01
Adagrad
4
0.6039
15
5
0.01
RMSprop
16
0.6182
20
100
0.001
Adam
8
0.6127
BiGRU
5
25
0.01
RMSprop
4
0.6205
10
10
0.01
SGD
16
0.6264
15
5
0.001
RMSprop
8
0.6097
20
25
0.01
SGD
8
0.6098
Model Time step No of neurons Learning rate Optimizer Batch size Best validation accuracy
TextBlob sentiment data, respectively. Subplots of Figures 6 and 7 illustrate the overall trends in average sensitivity, specificity, accuracy, and AUC scores for each model architecture.
Identifying the best-performing models from respective architectures
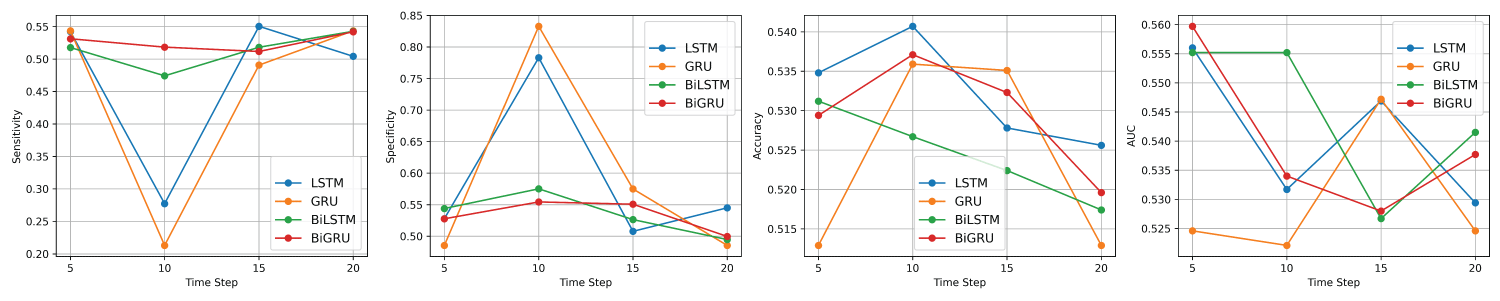
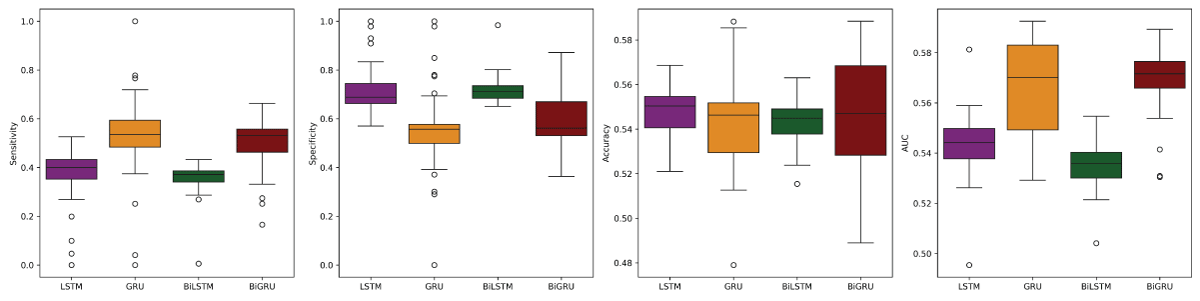
Once the hyperparameters were tuned, the models were set with their respective optimized values. In total, 16 models (4×4 = 16) were trained for each dataset (VADER and TextBlob sentiment data). These models were then evaluated on the test data to assess their performance and reliability. To account for the stochastic nature of deep learning models, each model was replicated 30 times. Figure 6 and Figure 7 present graphical representations of the average performance metrics for the four model architectures (LSTM, GRU, BiLSTM, and BiGRU) on the test sets of the VADER and trends in average sensitivity, specificity, accuracy, and AUC scores for each model architecture.
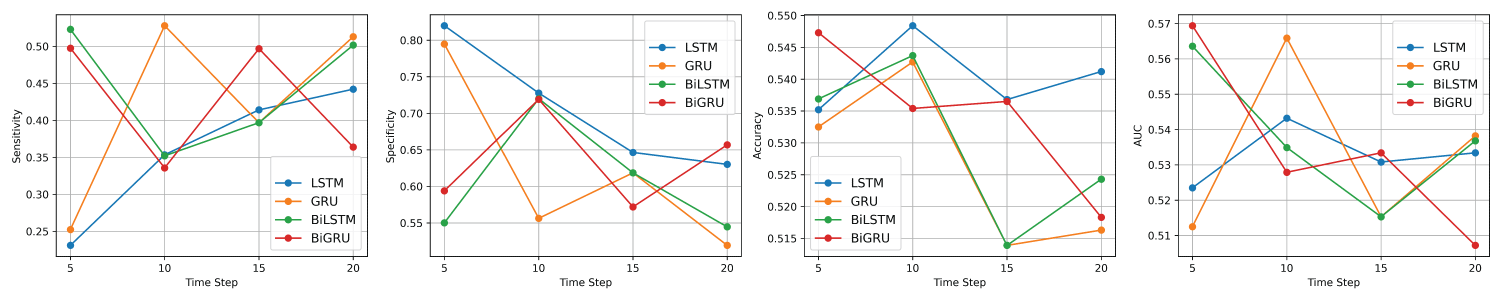
Figure 6: Average performance metrics of the LSTM, GRU, BiLSTM, and BiGRU models on the test dataset of VADER sentiment data from left to right: Sensitivity, Specificity, Accuracy, and AUC.
For the VADER sentiment data, a comprehensive assessment of the performance metrics reveals that the overall accuracy of the four deep learning models—LSTM, GRU, BiLSTM, and BiGRU—is relatively similar, with only slight variations across the different time steps. Nonetheless, a detailed analysis of each model’s performance at time steps 5, 10, 15, and 20, as illustrated in Figure 6, offers valuable insights into the optimal sequence length for each architecture.
For the LSTM model, time step 10 yielded the highest accuracy, suggesting that a moderate sequence length provides the most reliable predictions. Time step 5 followed closely, while accuracy declined slightly at steps 15 and 20. These findings suggest that increasing the sequence length beyond a certain point does not necessarily enhance performance and may even introduce noise or overfitting. Thus, time step 10 is the most effective configuration for LSTM when maximizing accuracy.
In the case of the GRU model, time step 10 again yielded the highest accuracy, followed closely by time step 15. Time steps 5 and 20 produced identical but lower accuracy values, indicating diminished effectiveness at both the shortest and longest sequence lengths. These results highlight that moderate sequence lengths (particularly 10 and 15) are the most suitable for GRU, with time step 10 offering a slight edge.
For the BiLSTM model, the highest accuracy was observed at time step 5, suggesting that shorter sequences are more effective for this architecture. Performance declined steadily at longer time steps, with the lowest accuracy at step 20. This trend implies that BiLSTM may be more sensitive to the input length, with longer sequences potentially introducing redundancy or noise. Therefore, time step 5 is the optimal configuration for BiLSTM when accuracy is the primary goal.
Lastly, the BiGRU model exhibited its highest accuracy at time step 10, followed by time step 15. Time step 5 produced a slightly lower, but still competitive, accuracy, while time step 20 showed the weakest performance. This pattern suggests that BiGRU benefits from moderately long sequences and, like the other models, experiences diminishing returns with excessively long inputs. As such, time step 10 emerges as the best configuration for BiGRU in terms of accuracy. Table 6 summarizes the best-performing configurations for each model, along with their corresponding hyperparameters for VADER sentiment data.
Table 6: Best performing LSTM, GRU, BiLSTM, and BiGRU models with their best hyperparameters for VADER sentiment data.
Model
Time Step
No. of Neurons
Learning Rate
Optimizer
Batch Size
LSTM
10
5
0.01
SGD
8
GRU
10
25
0.001
SGD
8
BiLSTM
5
25
0.01
RMSprop
8
BiGRU
10
10
0.1
SGD
8
Similarly, for the TextBlob sentiment data, a comprehensive analysis of the performance metrics shows that the overall accuracy of the four deep learning models—LSTM, GRU, BiLSTM, and BiGRU—is relatively consistent across the four time steps (5, 10, 15, and 20). Nonetheless, Figure 7 reveals notable differences that emerge upon closer examination of each model and its specific configuration.
Figure 7: Average performance metrics of the LSTM, GRU, BiLSTM, and BiGRU models on the test dataset of TextBlob sentiment data from left to right: Sensitivity, Specificity, Accuracy, and AUC.
For the LSTM model, accuracy peaked at time step 10, slightly outperforming the value at time step 5, while accuracy declined marginally at time steps 15 and 20. This suggests that a moderate sequence length provides the most reliable performance for LSTM, balancing the benefits of temporal context without overcomplicating the model input. Therefore, time step 10 emerges as the optimal configuration for LSTM when accuracy is prioritized.
In the case of the GRU model, time step 10 again produced the highest accuracy, followed by time step 5. However, performance declined more noticeably at time steps 15 and 20, indicating reduced effectiveness with longer sequences. These results suggest that GRU benefits most from shorter to mid-length sequences, with time step 10 offering the best balance between sequence information and generalization performance.
For the BiLSTM model, the highest accuracy was observed at time step 10, followed closely by time step 5. Accuracy declined sharply at time step 15 and recovered slightly at time step 20, indicating that BiLSTM struggles with longer sequences. The performance pattern suggests that BiLSTM performs best with shorter sequences, with time step 10 providing a strong alternative.
Finally, the BiGRU model showed its highest accuracy at time step 5, followed by time step 15 and time step 10. Performance declined at time step 20, indicating that overly long sequences may impair generalization. Despite the relatively stable performance across all time steps, time step 5 appears to be the optimal configuration for BiGRU, offering the best classification accuracy among the four options.
Table 7 summarizes the best-performing configurations for each model along with their associated hyperparameters, highlighting how sequence length tuning can meaningfully impact model performance for TextBlob sentiment data.
Table 7: Best performing LSTM, GRU, BiLSTM, and BiGRU models with their best hyperparameters for TextBlob sentiment data.
Model
Time Step
No. of Neurons
Learning Rate
Optimizer
Batch Size
LSTM
10
5
0.01
Adagrad
4
GRU
10
50
0.01
Adam
8
BiLSTM
10
10
0.01
Adagrad
4
BiGRU
5
25
0.01
RMSprop
4
Identifying the overall best model
After identifying the best-performing models within each architecture, we conducted a comparative analysis to determine the overall top-performing model among the four. Tables 8 and 9 present the summary statistics of the performance scores for the top models based on VADER and TextBlob sentiment data, respectively.
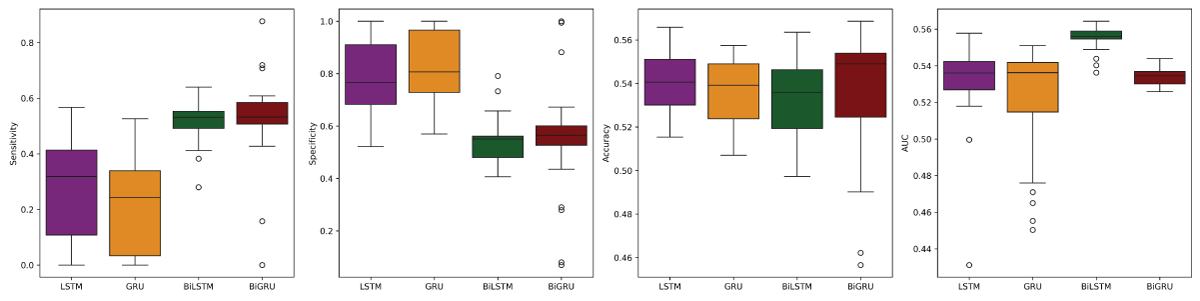
For the VADER sentiment data, the LSTM model with a time step of 10 achieved the highest accuracy of 0.5407 and the lowest standard deviation in accuracy (0.0141), indicating strong and consistent performance. This observation is further supported by the boxplots in Figure 8, which show that the distributions of performance scores across all four models are approximately symmetric, suggesting reliable model behavior. Among these, the LSTM model not only exhibits the best accuracy but also the lowest variability. Based on the evidence from Table 8 and Figure 8, the LSTM model with a time step of 10 emerges as the best performer, followed by BiGRU (time step 10), GRU (time step 10), and BiLSTM (time step 5).
Table 8: Model performance matrices obtained using test VADER sentiment data.
Models
Metrics
Sensitivity
Specificity
Accuracy
AUC
LSTM
Mean ± Std
0.2772 ± 0.1828
0.7830 ± 0.1502
0.5407 ± 0.0141
0.5317 ± 0.0224
Maximum
0.5673
1.0000
0.5658
0.5578
Minimum
0.0000
0.5215
0.5154
0.4312
GRU
Mean ± Std
0.2129 ± 0.1629
0.8328 ± 0.1274
0.5359 ± 0.0149
0.5221 ± 0.0313
Maximum
0.5263
1.0000
0.5574
0.5510
Minimum
0.0000
0.5699
0.5070
0.4504
BiLSTM
Mean ± Std
0.5177 ± 0.0724
0.5439 ± 0.0852
0.5312 ± 0.0169
0.5552 ± 0.0065
Maximum
0.6400
0.7914
0.5635
0.5343
Minimum
0.2800
0.4064
0.4972
0.5363
BiGRU
Mean ± Std
0.5183 ± 0.1902
0.5543 ± 0.2019
0.5371 ± 0.0285
0.5340 ± 0.0052
Maximum
0.8772
1.0000
0.5686
0.5439
Minimum
0.0000
0.0699
0.4566
0.5259
Figure 8: Boxplots of metrics from left: sensitivity, specificity, accuracy, and AUC for the models using VADER sentiment data.
Similarly, for the TextBlob sentiment data, the LSTM model with a time step of 10 achieved the highest accuracy of 0.5484 and a relatively low standard deviation of 0.0120. Figure 9 reinforces this result, showing symmetric distributions and low variability, particularly for the LSTM model. These consistent and superior scores highlight the robustness of the LSTM architecture. Therefore, based on Table 9 and Figure 9, the LSTM model with a time step of 10 is the top-performing model, followed by BiGRU (time step 5), BiLSTM (time step 10), and GRU (time step 10).
Table 10: Hypothesis together with the P-values of Kruskal Wallis test within the models.
Data Type
Hypothesis
p - value
VADER Sentiment Data
H0: The accuracy of all 4 models are the same. H0: At least one model has significantly different accuracy.
0.1557
TextBlob Sentiment Data
H0: The accuracy of all 4 models are the same. H0: At least one model has significantly different accuracy.
0.3687
Figure 9: Boxplots of metrics from left: sensitivity, specificity, accuracy, and AUC for the models using TextBlob sentiment data.
Figure 8 Boxplots of metrics from left: sensitivity, specificity, accuracy, and AUC for Figure 9 Boxplots of metrics from left: sensitivity, specificity, accuracy, and AUC for
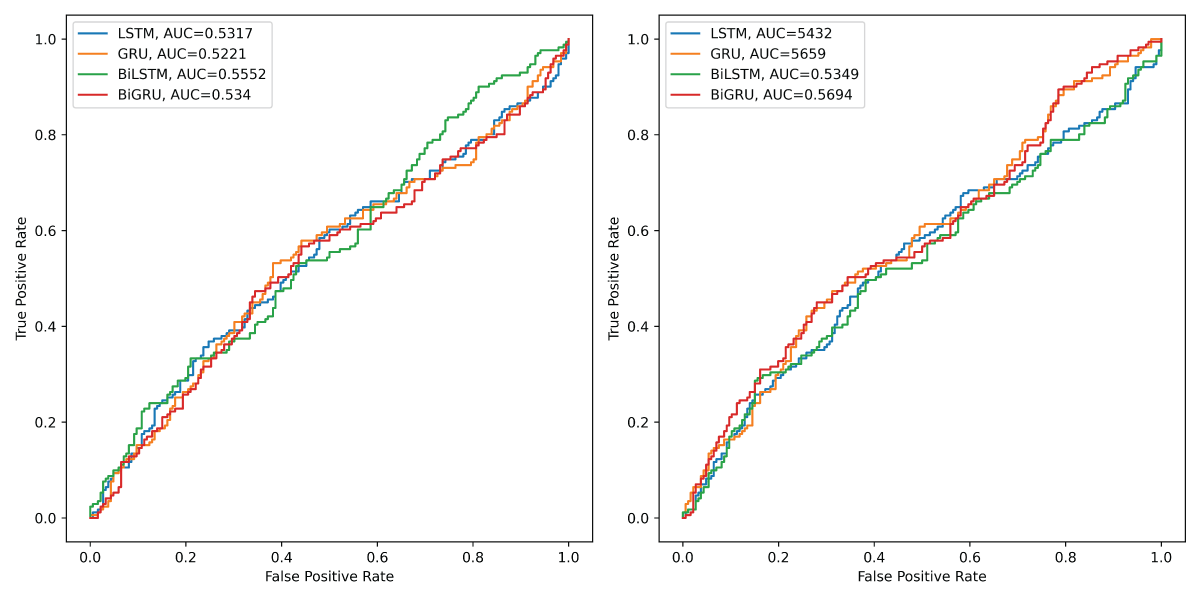
Based on the ROC curves and their corresponding AUC values for VADER sentiment data depicted in Figure 10 (left), the BiLSTM model demonstrates the strongest discriminatory performance among the four deep learning architectures, achieving the highest AUC of 0.5552. This suggests that BiLSTM is slightly better at distinguishing between positive and negative sentiment classes compared to the others. BiGRU follows with an AUC of 0.5340, indicating modest but improved discrimination relative to LSTM and GRU. LSTM achieves an AUC of 0.5317, showing similar performance to BiGRU, while GRU records the lowest AUC of 0.5221, reflecting the weakest ability to separate the classes. Although the differences in AUC values are relatively small, the results suggest that bidirectional models (BiLSTM and BiGRU) offer a slight advantage in capturing contextual information for sentiment classification, leading to marginally better performance overall.
Figure 10: Left: ROC curves of the four models for VADER sentiment data. Right: ROC curves of the four models for TextBlob sentiment data.
Similarly, based on the ROC curves and the corresponding AUC values for TextBlob sentiment data depicted in Figure 10 (right), BiGRU achieves the highest AUC of 0.5694, indicating the strongest discriminatory capability among the four deep learning models for classifying sentiment. GRU closely follows with an AUC of 0.5659, suggesting that both models effectively capture temporal patterns and dependencies in the sentiment data. LSTM and BiLSTM exhibit slightly lower AUC values of 0.5432 and 0.5349, respectively, reflecting comparatively weaker performance in distinguishing between positive and negative classes. These results highlight the effectiveness of GRU-based architectures, particularly BiGRU, which likely benefits from its bidirectional structure and gating mechanism. Overall, the GRU and BiGRU models outperform their LSTM counterparts, suggesting their superior ability to model the underlying sentiment dynamics in the dataset.
Statistical analysis
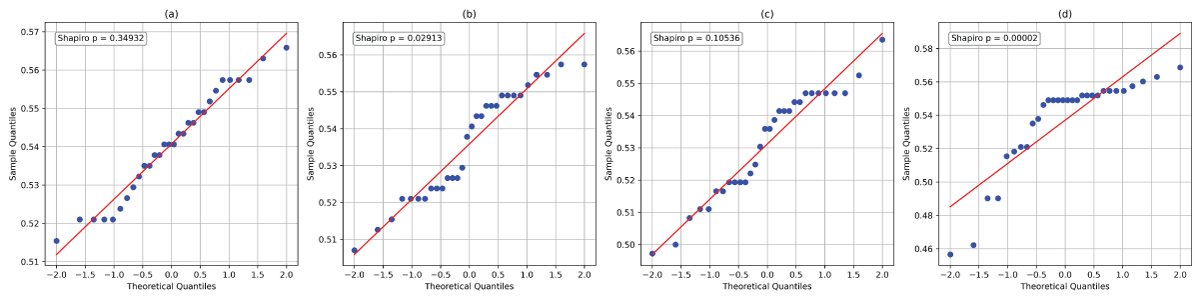
The model assessment metrics and visualization techniques presented above do not offer conclusive evidence to determine a single best-performing model. To further investigate whether the observed differences in model performance are statistically significant, we apply formal statistical testing. This evaluation can be conducted using both parametric and non-parametric approaches. As a starting point under parametric analysis, we consider the one-way analysis of variance (ANOVA), which is widely used due to its simplicity and interpretability. However, the reliability of ANOVA hinges on the assumption that the underlying data are normally distributed. If this assumption is not met, the accuracy of the resulting p-values may be compromised [88].
To evaluate the normality assumption, we utilize Quantile-Quantile (QQ) plots. The QQ plots generated for the accuracy scores from 30 replications of the LSTM, GRU, BiLSTM, and BiGRU models (shown in Figure 11(a)–11(d)) for VADER sentiment data suggest potential deviations from normality. To substantiate these visual observations, we performed formal Shapiro hypothesis tests for normality [89]. The p-values obtained for GRU and BiGRU models, 0.02913 and 0.00002, respectively (as shown in Figures 11(b) and 11(d)), are significantly below the conventional threshold of 0.05. These findings confirm that the distributions of accuracies for GRU and BiGRU are not normally distributed. As a result, the assumption required for ANOVA is violated, rendering it unsuitable for this analysis.
Figure 11: Q-Q plots of the accuracies corresponding to the models: (a) LSTM, (b) GRU, (c) BiLSTM, and (d) BiGRU for VADER sentiment data.
As the Kruskal-Wallis test [90] is a non-parametric alternative to ANOVA that does not require normality or homogeneity of variance, it is utilized for this analysis. The test is conducted to evaluate the hypotheses presented in Table 10. For the VADER sentiment data, the Kruskal-Wallis test yields a p-value of 0.1557, while for the TextBlob sentiment data, the p-value is 0.3687. Since both p-values exceed the significance threshold of 0.05, we fail to reject the null hypothesis in each case. This indicates that there is insufficient evidence to conclude that any one model has significantly different prediction accuracy compared to the others. In simpler terms, the performance differences among the four models are not statistically significant.
We now turn to one of the key contributions outlined in the introduction: “Identifying the sentiment analyzer that aligns most effectively with the deep learning models.” To address this, we perform pairwise comparisons using the Mann-Whitney U test [91] between models within the VADER and TextBlob sentiment datasets. The Mann-Whitney test is selected over the two-sample t-test due to the non-normal distribution of the accuracy scores, as observed in Figures 11(b) and 11(d). Additionally, the Mann-Whitney U test is a non-parametric method, which makes it suitable for this analysis as it does not require any distributional assumptions. The hypothesis together with the p-value of the pairwise Mann-Whitney tests for the LSTM, GRU, BiLSTM, and BiGRU within the VADER and TextBlob sentiment data are presented in Table 11.
Table 11: Hypothesis together with the P-values of Mann-Whitney test for the models within the VADER and TextBlob sentiment data.
Model
Hypothesis
p - value
LSTM
H0: There is no significant difference in the accuracy of the LSTM model between the VADER and TextBlob sentiment datasets H1: There is a significant difference in the accuracy of the LSTM model between the VADER and TextBlob sentiment datasets.
0.0386
GRU
H0: There is no significant difference in the accuracy of the GRU model between the VADER and TextBlob sentiment datasets H1: There is a significant difference in the accuracy of the GRU model between the VADER and TextBlob sentiment datasets.
0.1439
BiLSTM
H0: There is no significant difference in the accuracy of the BiLSTM model between the VADER and TextBlob sentiment datasets H1: There is a significant difference in the accuracy of the BiLSTM model between the VADER and TextBlob sentiment datasets.
0.0098
BiGRU
H0: There is no significant difference in the accuracy of the BiGRU model between the VADER and TextBlob sentiment datasets H1: There is a significant difference in the accuracy of the BiGRU model between the VADER and TextBlob sentiment datasets.
0.6838
The results presented in Table 11 reveal that the LSTM and BiLSTM models show statistically significant differences in accuracy between the VADER and TextBlob sentiment datasets, with p-values of 0.0386 and 0.0098, respectively. Since these values fall below the 0.05 significance threshold, we reject the null hypotheses for these two models. In contrast, the GRU and BiGRU models yield p-values of 0.1439 and 0.6838, indicating no statistically significant performance differences between the two sentiment analyzers. These findings suggest that the choice of sentiment analyzer has a greater influence on the performance of LSTM and BiLSTM models compared to GRU-based architectures. Furthermore, when these results are considered alongside the model performance summaries in Table and Table 7, it becomes evident that both LSTM and BiLSTM models perform better with the TextBlob sentiment data than with the VADER sentiment data. Market, particularly during geopolitical tensions, global supply chain disruptions, conflicts, pandemics, and other market risks. Thus, stakeholders stand to benefit from an appropriate analysis of the current market behavior fused with the model’s outcomes.
Equity traders, individual investors, and portfolio managers inherently seek to predict stock prices and projected returns. This research indicates the promising potential of deep learning architecture in delineating the cone of uncertainty in stock price prediction. Furthermore, academic researchers can extend the applicability of deep learning algorithms in the financial market.
The limited predictive performance of deep learning models—LSTM, GRU, BiLSTM, and BiGRU—in forecasting NEPSE stock movements can be attributed to several interrelated factors, including the nature of the data, the linguistic and contextual complexity of financial news, and the inherent limitations of these models when applied to underdeveloped financial markets. This study primarily employed the VADER and TextBlob sentiment analyzers on financial news headlines from Nepal, highlighting the role of sentiment in shaping market trends. The findings indicate that sentiment analysis is substantially less accurate in underdeveloped markets such as Nepal, reflecting structural differences in financial reporting, market behavior, and linguistic nuances.
A critical challenge arises from the subtleties of the financial language used in NEPSE news headlines. Both VADER and TextBlob demonstrated difficulties in correctly classifying negative and neutral sentiments, as illustrated in Tables 12 and 13. Headlines often contain domain-specific terminology, subtle quantitative references, and mixed sentiment cues, which lexicon-based models frequently misinterpret. For example, terms such as “plunge,” “slip,” or “dwindle” carry strong negative connotations in a financial context, yet the models often default to neutral due to a lack of contextual awareness. Similarly, numerical trends embedded in the text, such as “plunge 7.53 points” or “settle 1,386.98 points,” provide critical sentiment information that these models struggle to incorporate.
Table 12: Examples of Misclassification by TextBlob: Neutral Sentiment Errors
Cleaned News Headlines
Actual
TextBlob
Political influence market turnover touch Rs 863 million Nepse gain 30 point
Positive
Neutral
Political confrontation weaken investor confidence Nepse drop 12.65 point
Negative
Neutral
Nepse dwindles double figure market close 1,206.43 point Lose 17.96 point
Negative
Neutral
Nepse green long time turnover 19 crore
Positive
Neutral
Table 13: Examples of Misclassification by Both VADER and TextBlob for NEPSE Cleaned News Headlines
NEPSE Cleaned News Headlines
Actual
Predicted
Know company decrease give best return FY 2071/72 complete analysis Nepse last FY
Neutral
Positive
Nepse slip 960 level plunge 7.53 point
Negative
Neutral
Nepse fall 2 day row
Negative
Neutral
Nepse plunge point close 951.29 level
Negative
Neutral
Nepse face double digit plunge close 971.47 level
Negative
Neutral
Early public holiday Dashain Nepse open till Kartik 02
Neutral
Positive
Nepse decline 0.10 point last day week settle 1,386.98 point
Negative
Neutral
LSTM, GRU, BiLSTM, and BiGRU models rely on sequences of word embeddings to capture patterns over time, making the quality and representativeness of these embeddings pivotal. When embeddings are trained on limited or noisy data, as is the case with NEPSE headlines, the models fail to learn the subtle associations between words, numbers, and market sentiment, resulting in weak predictive power.
Moreover, the size and richness of the dataset further constrain model performance. Unlike large, high-frequency financial markets in developed economies, NEPSE news data is comparatively sparse and less structured, providing insufficient training examples for deep learning models to generalize effectively. Sequence models like LSTM and GRU are particularly data-hungry; they perform best when they can capture long-term dependencies across thousands of examples. In the NEPSE context, headlines are brief, datasets are limited, and many signals are noisy or ambiguous, preventing the models from reliably learning predictive patterns. Bidirectional variants such as BiLSTM and BiGRU can capture context from both past and future tokens, but they still cannot overcome the challenges posed by insufficient labeled examples and domain-specific complexities.
Finally, the intrinsic unpredictability of stock markets, especially in emerging economies, compounds the difficulty. Even when sentiment is accurately extracted, market reactions are influenced by numerous exogenous factors—including macroeconomic conditions, regulatory changes, and investor behavior—that are not captured in textual headlines. This partially explains why the predictive accuracy of deep learning models remains only marginally above random chance for NEPSE stock movements. These limitations highlight the necessity of either integrating more sophisticated, domain-specific embeddings, adopting hybrid models that combine lexicon-based and deep learning approaches, or incorporating additional market features beyond sentiment to improve predictive reliability.
In summary, LSTM, GRU, BiLSTM, and BiGRU struggle to predict NEPSE stock movements primarily due to domain-specific language complexities, limited and noisy datasets, insufficient training examples, and the inherently stochastic nature of the emerging market. These findings underscore the importance of context-aware, domain-adapted approaches for financial sentiment analysis in underdeveloped market settings.
The detection of stock price movements is becoming increasingly crucial for all stakeholders involved in making the foremost financial decisions, whether directly or indirectly. However, achieving precise and consistent predictions is challenging due to the stock market’s volatile, nonlinear, noisy, chaotic, non-parametric, and fuzzy nature. Notably, the existing literature lacks a comparative analysis focusing solely on human sentiment for predicting stock price movement direction using unstructured data.
This article aims to address this gap by conducting a comparative study of deep learning models under uniform conditions, leveraging financial news headlines to discern the influence of textual data on predicting stock price movement direction. The study evaluates the effectiveness of LSTM, GRU, BiLSTM, and BiGRU models in detecting stock price movement using news headlines. Sentiment scores, derived from the Valence Aware Dictionary for Sentiment Reasoning (VADER) or the TextBlob analyzer, serve as the sole input for these models.
Model performance is evaluated using sensitivity, specificity, accuracy, and the area under the receiver operating characteristic (ROC) curve (AUC), with accuracy prioritized due to the balanced nature of the data. The experimental results indicate that, when using sentiment scores from the TextBlob analyzer, there are no statistically significant performance differences among the models. A similar trend is observed with sentiment scores from the VADER analyzer, where model performances also do not differ significantly. Furthermore, the GRU and BiGRU models show no significant performance differences between the VADER and TextBlob sentiment data. However, slight discrepancies are noted for the LSTM and BiLSTM models when comparing performance across the two sentiment analyzers. Specifically, both LSTM and BiLSTM models perform better when using sentiment scores derived from the TextBlob analyzer than those obtained from the VADER analyzer.
In our upcoming endeavors, we aim to fuse the existing models with neural network architectures like transformers to create hybrid predictive models. Additionally, we intend to introduce a hybrid optimization algorithm that combines local and global optimizers to train model parameters. Expanding the scope of our model development, we will consider incorporating sentiments from various media sources beyond financial news. Furthermore, we are committed to exploring the implementation of evolutionary algorithms to achieve cutting-edge performance.
Declarations
Ethical approval: This study is based on publicly available data. No human participants or animals were involved; therefore, ethical approval was not required.
Availability of data and material: The data are publicly available on the website of ShareSansar.
Code availability: The Python code for this project can be provided upon request, if needed.
Authors’ contributions: Dahal, as the sole author, independently conducted all experiments, conceptualized the study, performed Python coding, data analysis, and figure generation, and solely wrote and critically reviewed the entire manuscript.
Bosworth B, Hymans S, Modigliani F. The stock market and the economy. Brookings Pap Econ Act. 1975;1975(2):257-300.
Jones CM. A century of stock market liquidity and trading costs. SSRN [Internet]. 2002. Available from: https://ssrn.com/abstract=313681 (ssrn.com in Bing)
Ahangar RG, Yahyazadehfar M, Pournaghshband H. The comparison of methods artificial neural network with linear regression using specific variables for prediction stock price in the Tehran Stock Exchange. arXiv preprint arXiv:1003.1457. 2010.
Weng B, Ahmed MA, Megahed FM. Stock market one-day ahead movement prediction using disparate data sources. Expert Syst Appl. 2017;79:153-63.
Gandhmal DP, Kumar K. Systematic analysis and review of stock market prediction techniques. Comput Sci Rev. 2019;34:100190.
Hansen JV, McDonald JB, Nelson RD. Time series prediction with genetic algorithm-designed neural networks: An empirical comparison with modern statistical models. Comput Intell. 1999;15(3):171-84.
Fama EF. Random walks in stock market prices. Financ Anal J. 1995;51(1):75-80.
Devi BU, Sundar D, Alli P. An effective time series analysis for stock trend prediction using the ARIMA model for Nifty Midcap-50. Int J Data Min Knowl Manag Process. 2013;3(1):65.
Dhyani B, Kumar M, Verma P, Jain A. Stock market forecasting technique using ARIMA model. Int J Recent Technol Eng. 2020;8(6):2694-7.
Garlapati A, Krishna DR, Garlapati K, Rahul U, Narayanan G, et al. Stock price prediction using Facebook Prophet and ARIMA models. In: 2021 6th International Conference for Convergence in Technology (I2CT). IEEE; 2021. p. 1-7.
Bisoi R, Dash P, Parida A. Hybrid variational mode decomposition and evolutionary robust kernel extreme learning machine for daily stock price and movement prediction. Appl Soft Comput. 2019;74:652-78.
Nelson DM, Pereira AC, De Oliveira RA. Stock market’s price movement prediction with LSTM neural networks. In: 2017 International Joint Conference on Neural Networks (IJCNN). IEEE; 2017. p. 1419-26.
Chen S, Ge L. Exploring the attention mechanism in LSTM-based Hong Kong stock price movement prediction. Quant Finance. 2019;19(9):1507-15.
Long W, Lu Z, Cui L. Deep learning-based feature engineering for stock price movement prediction. Knowl-Based Syst. 2019;164:163-73.
Derakhshan A, Beigy H. Sentiment analysis on stock social media for stock price movement prediction. Eng Appl Artif Intell. 2019;85:569-78.
Zhao Y, Yang G. Deep learning-based integrated framework for stock price movement prediction. Appl Soft Comput. 2023;133:109921.
Xu Y, Cohen SB. Stock movement prediction from tweets and historical prices. In: Proc 56th Annu Meet Assoc Comput Linguist. 2018;1:1970-9.
Wang Y. Stock price direction prediction by directly using price data: an empirical study on the KOSPI and HSI. Int J Bus Intell Data Min. 2014;9(2):145-60.
Kara Y, Boyacioglu MA, Baykan ÖK. Predicting direction of stock price index movement using artificial neural networks and support vector machines: The sample of the Istanbul stock exchange. Expert Syst Appl. 2011;38(5):5311-9.
Khoa BT, Huynh TT. Forecasting stock price movement direction by machine learning algorithm. Int J Electr Comput Eng. 2022;12(6):6625.
Ismail MS, Noorani MSM, Ismail M, Razak FA, Alias MA. Predicting next day direction of stock price movement using machine learning methods with persistent homology: Evidence from Kuala Lumpur stock exchange. Appl Soft Comput. 2020;93:106422.
Tafti A, Zotti R, Jank W. Real-time diffusion of information on Twitter and the financial markets. PLoS One. 2016;11(8):0159226.
Long W, Guo M. Social media and capital markets: an interdisciplinary bibliometric analysis. Financ Innov. 2025;11(1):77.
Smith S, O’Hare A. Comparing traditional news and social media with stock price movements: Which comes first, the news or the price change? J Big Data. 2022;9(1):47.
Ge Q, Kurov A, Wolfe MH. Stock market reactions to presidential social media usage: Evidence from company-specific tweets. SSRN Electron J. 2017.
Ge Q, Kurov A, Wolfe MH. Stock market reactions to presidential statements: Evidence from company-specific tweets. Econ Fac Scholarsh. 2018;2.
Zhao S. Nepal stock market movement prediction with machine learning. In: Proc 2021 5th Int Conf Inf Syst Data Min. 2021. p. 1-7.
Tang P, Tang C, Wang K. Stock movement prediction: A multi-input LSTM approach. J Forecast. 2024.
Dahal KR, Pokhrel NR, Gaire S, Mahatara S, Joshi RP, Gupta A, Banjade HR, Joshi J. A comparative study on the effect of news sentiment on stock price prediction with deep learning architecture. PLoS One. 2023;18(4):0284695.
Dahal KR, Gupta A, Pokhrel NR. Predicting the direction of Nepse index movement with news headlines using machine learning. Econometrics. 2024;12(2):16.
Bhandari HN, Rimal B, Pokhrel NR, Rimal R, Dahal KR. LSTM-SDM: An integrated framework of LSTM implementation for sequential data modeling. Softw Impacts. 2022;14:100396.
Bhandari HN, Pokhrel NR, Rimal R, Dahal KR, Rimal B. Implementation of deep learning models in predicting ESG index volatility. Financ Innov. 2024;10(1):75.
Pokhrel NR, Dahal KR, Rimal R, Bhandari HN, Rimal B. Deep-SDM: A unified computational framework for sequential data modeling using deep learning models. Softw. 2024;3(1):47-61.
Chen AS, Leung MT, Daouk H. Application of neural networks to an emerging financial market: forecasting and trading the Taiwan stock index. Comput Oper Res. 2003;30(6):901-23.
Huang W, Nakamori Y, Wang SY. Forecasting stock market movement direction with support vector machine. Comput Oper Res. 2005;32(10):2513-22.
Ballings M, Poel D, Hespeels N, Gryp R. Evaluating multiple classifiers for stock price direction prediction. Expert Syst Appl. 2015;42(20):7046-56.
Ren R, Wu DD, Liu T. Forecasting stock market movement direction using sentiment analysis and support vector machine. IEEE Syst J. 2018;13(1):760-70.
Qiu M, Song Y. Predicting the direction of stock market index movement using an optimized artificial neural network model. PLoS One. 2016;11(5):0155133.
Imandoust SB, Bolandraftar M. Forecasting the direction of stock market index movement using three data mining techniques: the case of Tehran stock exchange. Int J Eng Res Appl. 2014;4(6):106-17.
Chandola D, Mehta A, Singh S, Tikkiwal VA, Agrawal H. Forecasting directional movement of stock prices using deep learning. Ann Data Sci. 2023;10(5):1361-78.
Ampomah EK, Qin Z, Nyame G. Evaluation of tree-based ensemble machine learning models in predicting stock price direction of movement. Information. 2020;11(6):332.
Fazlija B, Harder P. Using financial news sentiment for stock price direction prediction. Mathematics. 2022;10(13):2156.
Rustam Z, Vibranti D, Widya D. Predicting the direction of Indonesian stock price movement using support vector machines and fuzzy kernel c-means. AIP Conf Proc. 2018;2023.
Kim S, Ku S, Chang W, Song JW. Predicting the direction of US stock prices using effective transfer entropy and machine learning techniques. IEEE Access. 2020;8:111660-82.
Long J, Chen Z, He W, Wu T, Ren J. An integrated framework of deep learning and knowledge graph for prediction of stock price trend: An application in Chinese stock exchange market. Appl Soft Comput. 2020;91:106205.
Zhang X, Liu S, Zheng X. Stock price movement prediction based on a deep factorization machine and the attention mechanism. Mathematics. 2021;9(8):800.
Zhang X, Gu N, Chang J, Ye H. Predicting stock price movement using a DBN-RNN. Appl Artif Intell. 2021;35(12):876-92.
Kumar A, Alsadoon A, Prasad P, Abdullah S, Rashid TA, Pham DTH, Nguyen TQV. Generative adversarial network (GAN) and enhanced root mean square error (ERMSE): deep learning for stock price movement prediction. Multimed Tools Appl. 2022;1-19.
Gao P, Zhang R, Yang X. The application of stock index price prediction with neural network. Math Comput Appl. 2020;25(3):53.
Shahi TB, Shrestha A, Neupane A, Guo W. Stock price forecasting with deep learning: A comparative study. Mathematics. 2020;8(9):1441.
Kunwar B, Khati P. Predictive analysis of Nepse using LSTM and technical indicators. Int Res J Innov Eng Technol. 2023;7(10):1.
Prasad D, Kadariya S. Stock returns: Nepalese investors’ reactions to news coverage. J Account Finance. 2022;22(3).
Illia F, Eugenia MP, Rutba SA. Sentiment analysis on pedulilindungi application using TextBlob and Vader library. In: Proc Int Conf Data Sci Off Stat. 2021; p. 278-88.
Abiola O, Abayomi-Alli A, Tale OA, Misra S, Abayomi-Alli O. Sentiment analysis of COVID-19 tweets from selected hashtags in Nigeria using Vader and TextBlob analyser. J Electr Syst Inf Technol. 2023;10(1):5.
Nemes L, Kiss A. Prediction of stock value changes using sentiment analysis of stock news headlines. J Inf Telecommun. 2021;5(3):375-94.
Zaini N, Ean LW, Ahmed AN, Malek MA. A systematic literature review of deep learning neural networks for time series air quality forecasting. Environ Sci Pollut Res. 2022;29(4):4958-90.
Hochreiter S. The vanishing gradient problem during learning recurrent neural nets and problem solutions. Int J Uncertain Fuzziness Knowl-Based Syst. 1998;6(02):107-16.
Gers FA, Schmidhuber J, Cummins F. Learning to forget: Continual prediction with LSTM. Neural Comput. 2000;12(10):2451-71.
Hochreiter S, Schmidhuber J. Long short-term memory. Neural Comput. 1997;9(8):1735-80.
Gers FA, Schraudolph NN, Schmidhuber J. Learning precise timing with LSTM recurrent networks. J Mach Learn Res. 2002;3:115-43.
Pokhrel NR, Dahal KR, Rimal R, Bhandari HN, Khatri RK, Rimal B, Hahn WE. Predicting the Nepse index price using deep learning models. Mach Learn Appl. 2022;9:100385.
Graves A, Jaitly N, Mohamed AR. Hybrid speech recognition with deep bidirectional LSTM. In: 2013 IEEE Workshop on Automatic Speech Recognition and Understanding. IEEE; 2013. p. 273-8.
Huang Z, Xu W, Yu K. Bidirectional LSTM-CRF models for sequence tagging. arXiv preprint arXiv:1508.01991. 2015.
Melamud O, Goldberger J, Dagan I. context2vec: Learning generic context embedding with bidirectional LSTM. In: Proc 20th SIGNLL Conf Comput Nat Lang Learn. 2016. p. 51-61.
Graves A, Schmidhuber J. Framewise phoneme classification with bidirectional LSTM and other neural network architectures. Neural Netw. 2005;18(5-6):602-10.
Greff K, Srivastava RK, Koutník J, Steunebrink BR, Schmidhuber J. LSTM: A search space odyssey. IEEE Trans Neural Netw Learn Syst. 2016;28(10):2222-39.
Graves A, Fernández S, Schmidhuber J. Bidirectional LSTM networks for improved phoneme classification and recognition. In: Int Conf Artif Neural Netw. Springer; 2005. p. 799-804.
Qiu J, Wang B, Zhou C. Forecasting stock prices with long-short term memory neural network based on attention mechanism. PLoS One. 2020;15(1):0227222.
Lei J, Liu C, Jiang D. Fault diagnosis of wind turbine based on long short-term memory networks. Renew Energy. 2019;133:422-32.
Rimal R, Rimal B, Bhandari HN, Pokhrel NR, Dahal KR. Real estate market prediction using deep learning models. Ann Data Sci. 2024;1-44.
Schuster M, Paliwal KK. Bidirectional recurrent neural networks. IEEE Trans Signal Process. 1997;45(11):2673-81.
Zhang A, Lipton ZC, Li M, Smola AJ. Dive into deep learning. arXiv preprint arXiv:2106.11342. 2021.
Dahal KR, Pokhrel NR, Subedi P, Gaire S, Bhandari R, Dahal M, Giwa M. Predicting coronary artery disease using machine learning. Int J Stat Probab. 2024;13(2).
Basak S, Kar S, Saha S, Khaidem L, Dey SR. Predicting the direction of stock market prices using tree-based classifiers. N Am J Econ Finance. 2019;47:552-67.
Dahal KR, Budhathoki N, Dahal A, Dhital S. Comparative performance of machine learning models for diabetes prediction among US adults using NHANES data. Int J Stat Probab. 2026;15(1).
Shrestha PM, Lamichhane P. Effect of firm-specific variables on stock returns: Evidence from Nepal. Quest J Manag Soc Sci. 2022;4(2):249-59.
Shrestha PM, Lamichhane P. Macroeconomic factors and stock market performance in Nepal. PYC Nepal J Manag. 2021;14(1):79-92.
Bird S. NLTK: the natural language toolkit. In: Proc COLING/ACL 2006 Interactive Presentation Sessions. 2006. p. 69-72.
Hutto C, Gilbert E. Vader: A parsimonious rule-based model for sentiment analysis of social media text. In: Proc Int AAAI Conf Web Soc Media. 2014;8:216-22.
Loria S, et al. TextBlob documentation. Release 0.15. 2018;2(8):269.
Bonta V, Kumaresh N, Janardhan N. A comprehensive study on lexicon-based approaches for sentiment analysis. Asian J Comput Sci Technol. 2019;8(S2):1-6.
Aljedaani W, Rustam F, Mkaouer MW, Ghallab A, Rupapara V, Washington PB, Lee E, Ashraf I. Sentiment analysis on Twitter data integrating TextBlob and deep learning models: The case of the US airline industry. Knowl-Based Syst. 2022;255:109780.
Al-Natour S, Turetken O. A comparative assessment of sentiment analysis and star ratings for consumer reviews. Int J Inf Manag. 2020;54:102132.
Liu B, et al. Sentiment analysis and subjectivity. In: Handbook of Natural Language Processing. 2nd ed. 2010. p. 627-66.
Dahal KR, Gupta A, Budhathoki N. Comparative analysis of Vader and TextBlob on financial news headlines. J Data Sci. 2025;1-20.
Brownlee J. Better Deep Learning: Train Faster, Reduce Overfitting, and Make Better Predictions. Ebook. Machine Learning Mastery; 2018.
Hecke TV. Power study of ANOVA versus Kruskal-Wallis test. J Stat Manag Syst. 2012;15(2-3):241-47.
Shapiro SS, Wilk MB. An analysis of variance test for normality (complete samples). Biometrika. 1965;52(3-4):591-611.
McKight PE, Najab J. Kruskal-Wallis test. Corsini Encycl Psychol. 2010;1-1.
McKnight PE, Najab J. Mann-Whitney U test. Corsini Encycl Psychol. 2010;1-1.
Dahal KR. Deep Learning-Based Prediction of Nepal Stock Exchange Movements from Financial News Headlines. IgMin Res. June 18, 2026; 4(6): 191-207. IgMin ID: igmin344; DOI:10.61927/igmin344; Available at: igmin.link/p344
Department of Mathematics, State University of New York Cortland, 22 Graham Ave, Cortland, 13045, NY, USA
Address Correspondence: Keshab Raj Dahal, Department of Mathematics, State University of New York Cortland, 22 Graham Ave, Cortland, 13045, NY, USA, Email: keshabraj.dahal@cortland.edu
How to cite this article: Dahal KR. Deep Learning-Based Prediction of Nepal Stock Exchange Movements from Financial News Headlines. IgMin Res. June 18, 2026; 4(6): 191-207. IgMin ID: igmin344; DOI:10.61927/igmin344; Available at: igmin.link/p344
Figure 1: Schematic diagram of the proposed research framewo...
Figure 2: BiLSTM architecture....
Figure 3: BiGRU architecture....
Figure 4: NEPSE closing price between January 1, 2017, to De...
Figure 5: Concatenation of movement direction and news senti...
Figure 6: Average performance metrics of the LSTM, GRU, BiLS...
Figure 7: Average performance metrics of the LSTM, GRU, BiLS...
Figure 8: Boxplots of metrics from left: sensitivity, specif...
Figure 9: Boxplots of metrics from left: sensitivity, specif...
Figure 10: Left: ROC curves of the four models for VADER sent...
Figure 11: Q-Q plots of the accuracies corresponding to the m...
Figure i1: ...
Figure i2: ...
Bosworth B, Hymans S, Modigliani F. The stock market and the economy. Brookings Pap Econ Act. 1975;1975(2):257-300.
Jones CM. A century of stock market liquidity and trading costs. SSRN [Internet]. 2002. Available from: https://ssrn.com/abstract=313681 (ssrn.com in Bing)
Ahangar RG, Yahyazadehfar M, Pournaghshband H. The comparison of methods artificial neural network with linear regression using specific variables for prediction stock price in the Tehran Stock Exchange. arXiv preprint arXiv:1003.1457. 2010.
Weng B, Ahmed MA, Megahed FM. Stock market one-day ahead movement prediction using disparate data sources. Expert Syst Appl. 2017;79:153-63.
Gandhmal DP, Kumar K. Systematic analysis and review of stock market prediction techniques. Comput Sci Rev. 2019;34:100190.
Hansen JV, McDonald JB, Nelson RD. Time series prediction with genetic algorithm-designed neural networks: An empirical comparison with modern statistical models. Comput Intell. 1999;15(3):171-84.
Fama EF. Random walks in stock market prices. Financ Anal J. 1995;51(1):75-80.
Devi BU, Sundar D, Alli P. An effective time series analysis for stock trend prediction using the ARIMA model for Nifty Midcap-50. Int J Data Min Knowl Manag Process. 2013;3(1):65.
Dhyani B, Kumar M, Verma P, Jain A. Stock market forecasting technique using ARIMA model. Int J Recent Technol Eng. 2020;8(6):2694-7.
Garlapati A, Krishna DR, Garlapati K, Rahul U, Narayanan G, et al. Stock price prediction using Facebook Prophet and ARIMA models. In: 2021 6th International Conference for Convergence in Technology (I2CT). IEEE; 2021. p. 1-7.
Bisoi R, Dash P, Parida A. Hybrid variational mode decomposition and evolutionary robust kernel extreme learning machine for daily stock price and movement prediction. Appl Soft Comput. 2019;74:652-78.
Nelson DM, Pereira AC, De Oliveira RA. Stock market’s price movement prediction with LSTM neural networks. In: 2017 International Joint Conference on Neural Networks (IJCNN). IEEE; 2017. p. 1419-26.
Chen S, Ge L. Exploring the attention mechanism in LSTM-based Hong Kong stock price movement prediction. Quant Finance. 2019;19(9):1507-15.
Long W, Lu Z, Cui L. Deep learning-based feature engineering for stock price movement prediction. Knowl-Based Syst. 2019;164:163-73.
Derakhshan A, Beigy H. Sentiment analysis on stock social media for stock price movement prediction. Eng Appl Artif Intell. 2019;85:569-78.
Zhao Y, Yang G. Deep learning-based integrated framework for stock price movement prediction. Appl Soft Comput. 2023;133:109921.
Xu Y, Cohen SB. Stock movement prediction from tweets and historical prices. In: Proc 56th Annu Meet Assoc Comput Linguist. 2018;1:1970-9.
Wang Y. Stock price direction prediction by directly using price data: an empirical study on the KOSPI and HSI. Int J Bus Intell Data Min. 2014;9(2):145-60.
Kara Y, Boyacioglu MA, Baykan ÖK. Predicting direction of stock price index movement using artificial neural networks and support vector machines: The sample of the Istanbul stock exchange. Expert Syst Appl. 2011;38(5):5311-9.
Khoa BT, Huynh TT. Forecasting stock price movement direction by machine learning algorithm. Int J Electr Comput Eng. 2022;12(6):6625.
Ismail MS, Noorani MSM, Ismail M, Razak FA, Alias MA. Predicting next day direction of stock price movement using machine learning methods with persistent homology: Evidence from Kuala Lumpur stock exchange. Appl Soft Comput. 2020;93:106422.
Tafti A, Zotti R, Jank W. Real-time diffusion of information on Twitter and the financial markets. PLoS One. 2016;11(8):0159226.
Long W, Guo M. Social media and capital markets: an interdisciplinary bibliometric analysis. Financ Innov. 2025;11(1):77.
Smith S, O’Hare A. Comparing traditional news and social media with stock price movements: Which comes first, the news or the price change? J Big Data. 2022;9(1):47.
Ge Q, Kurov A, Wolfe MH. Stock market reactions to presidential social media usage: Evidence from company-specific tweets. SSRN Electron J. 2017.
Ge Q, Kurov A, Wolfe MH. Stock market reactions to presidential statements: Evidence from company-specific tweets. Econ Fac Scholarsh. 2018;2.
Zhao S. Nepal stock market movement prediction with machine learning. In: Proc 2021 5th Int Conf Inf Syst Data Min. 2021. p. 1-7.
Tang P, Tang C, Wang K. Stock movement prediction: A multi-input LSTM approach. J Forecast. 2024.
Dahal KR, Pokhrel NR, Gaire S, Mahatara S, Joshi RP, Gupta A, Banjade HR, Joshi J. A comparative study on the effect of news sentiment on stock price prediction with deep learning architecture. PLoS One. 2023;18(4):0284695.
Dahal KR, Gupta A, Pokhrel NR. Predicting the direction of Nepse index movement with news headlines using machine learning. Econometrics. 2024;12(2):16.
Bhandari HN, Rimal B, Pokhrel NR, Rimal R, Dahal KR. LSTM-SDM: An integrated framework of LSTM implementation for sequential data modeling. Softw Impacts. 2022;14:100396.
Bhandari HN, Pokhrel NR, Rimal R, Dahal KR, Rimal B. Implementation of deep learning models in predicting ESG index volatility. Financ Innov. 2024;10(1):75.
Pokhrel NR, Dahal KR, Rimal R, Bhandari HN, Rimal B. Deep-SDM: A unified computational framework for sequential data modeling using deep learning models. Softw. 2024;3(1):47-61.
Chen AS, Leung MT, Daouk H. Application of neural networks to an emerging financial market: forecasting and trading the Taiwan stock index. Comput Oper Res. 2003;30(6):901-23.
Huang W, Nakamori Y, Wang SY. Forecasting stock market movement direction with support vector machine. Comput Oper Res. 2005;32(10):2513-22.
Ballings M, Poel D, Hespeels N, Gryp R. Evaluating multiple classifiers for stock price direction prediction. Expert Syst Appl. 2015;42(20):7046-56.
Ren R, Wu DD, Liu T. Forecasting stock market movement direction using sentiment analysis and support vector machine. IEEE Syst J. 2018;13(1):760-70.
Qiu M, Song Y. Predicting the direction of stock market index movement using an optimized artificial neural network model. PLoS One. 2016;11(5):0155133.
Imandoust SB, Bolandraftar M. Forecasting the direction of stock market index movement using three data mining techniques: the case of Tehran stock exchange. Int J Eng Res Appl. 2014;4(6):106-17.
Chandola D, Mehta A, Singh S, Tikkiwal VA, Agrawal H. Forecasting directional movement of stock prices using deep learning. Ann Data Sci. 2023;10(5):1361-78.
Ampomah EK, Qin Z, Nyame G. Evaluation of tree-based ensemble machine learning models in predicting stock price direction of movement. Information. 2020;11(6):332.
Fazlija B, Harder P. Using financial news sentiment for stock price direction prediction. Mathematics. 2022;10(13):2156.
Rustam Z, Vibranti D, Widya D. Predicting the direction of Indonesian stock price movement using support vector machines and fuzzy kernel c-means. AIP Conf Proc. 2018;2023.
Kim S, Ku S, Chang W, Song JW. Predicting the direction of US stock prices using effective transfer entropy and machine learning techniques. IEEE Access. 2020;8:111660-82.
Long J, Chen Z, He W, Wu T, Ren J. An integrated framework of deep learning and knowledge graph for prediction of stock price trend: An application in Chinese stock exchange market. Appl Soft Comput. 2020;91:106205.
Zhang X, Liu S, Zheng X. Stock price movement prediction based on a deep factorization machine and the attention mechanism. Mathematics. 2021;9(8):800.
Zhang X, Gu N, Chang J, Ye H. Predicting stock price movement using a DBN-RNN. Appl Artif Intell. 2021;35(12):876-92.
Kumar A, Alsadoon A, Prasad P, Abdullah S, Rashid TA, Pham DTH, Nguyen TQV. Generative adversarial network (GAN) and enhanced root mean square error (ERMSE): deep learning for stock price movement prediction. Multimed Tools Appl. 2022;1-19.
Gao P, Zhang R, Yang X. The application of stock index price prediction with neural network. Math Comput Appl. 2020;25(3):53.
Shahi TB, Shrestha A, Neupane A, Guo W. Stock price forecasting with deep learning: A comparative study. Mathematics. 2020;8(9):1441.
Kunwar B, Khati P. Predictive analysis of Nepse using LSTM and technical indicators. Int Res J Innov Eng Technol. 2023;7(10):1.
Prasad D, Kadariya S. Stock returns: Nepalese investors’ reactions to news coverage. J Account Finance. 2022;22(3).
Illia F, Eugenia MP, Rutba SA. Sentiment analysis on pedulilindungi application using TextBlob and Vader library. In: Proc Int Conf Data Sci Off Stat. 2021; p. 278-88.
Abiola O, Abayomi-Alli A, Tale OA, Misra S, Abayomi-Alli O. Sentiment analysis of COVID-19 tweets from selected hashtags in Nigeria using Vader and TextBlob analyser. J Electr Syst Inf Technol. 2023;10(1):5.
Nemes L, Kiss A. Prediction of stock value changes using sentiment analysis of stock news headlines. J Inf Telecommun. 2021;5(3):375-94.
Zaini N, Ean LW, Ahmed AN, Malek MA. A systematic literature review of deep learning neural networks for time series air quality forecasting. Environ Sci Pollut Res. 2022;29(4):4958-90.
Hochreiter S. The vanishing gradient problem during learning recurrent neural nets and problem solutions. Int J Uncertain Fuzziness Knowl-Based Syst. 1998;6(02):107-16.
Gers FA, Schmidhuber J, Cummins F. Learning to forget: Continual prediction with LSTM. Neural Comput. 2000;12(10):2451-71.
Hochreiter S, Schmidhuber J. Long short-term memory. Neural Comput. 1997;9(8):1735-80.
Gers FA, Schraudolph NN, Schmidhuber J. Learning precise timing with LSTM recurrent networks. J Mach Learn Res. 2002;3:115-43.
Pokhrel NR, Dahal KR, Rimal R, Bhandari HN, Khatri RK, Rimal B, Hahn WE. Predicting the Nepse index price using deep learning models. Mach Learn Appl. 2022;9:100385.
Graves A, Jaitly N, Mohamed AR. Hybrid speech recognition with deep bidirectional LSTM. In: 2013 IEEE Workshop on Automatic Speech Recognition and Understanding. IEEE; 2013. p. 273-8.
Huang Z, Xu W, Yu K. Bidirectional LSTM-CRF models for sequence tagging. arXiv preprint arXiv:1508.01991. 2015.
Melamud O, Goldberger J, Dagan I. context2vec: Learning generic context embedding with bidirectional LSTM. In: Proc 20th SIGNLL Conf Comput Nat Lang Learn. 2016. p. 51-61.
Graves A, Schmidhuber J. Framewise phoneme classification with bidirectional LSTM and other neural network architectures. Neural Netw. 2005;18(5-6):602-10.
Greff K, Srivastava RK, Koutník J, Steunebrink BR, Schmidhuber J. LSTM: A search space odyssey. IEEE Trans Neural Netw Learn Syst. 2016;28(10):2222-39.
Graves A, Fernández S, Schmidhuber J. Bidirectional LSTM networks for improved phoneme classification and recognition. In: Int Conf Artif Neural Netw. Springer; 2005. p. 799-804.
Qiu J, Wang B, Zhou C. Forecasting stock prices with long-short term memory neural network based on attention mechanism. PLoS One. 2020;15(1):0227222.
Lei J, Liu C, Jiang D. Fault diagnosis of wind turbine based on long short-term memory networks. Renew Energy. 2019;133:422-32.
Rimal R, Rimal B, Bhandari HN, Pokhrel NR, Dahal KR. Real estate market prediction using deep learning models. Ann Data Sci. 2024;1-44.
Schuster M, Paliwal KK. Bidirectional recurrent neural networks. IEEE Trans Signal Process. 1997;45(11):2673-81.
Zhang A, Lipton ZC, Li M, Smola AJ. Dive into deep learning. arXiv preprint arXiv:2106.11342. 2021.
Dahal KR, Pokhrel NR, Subedi P, Gaire S, Bhandari R, Dahal M, Giwa M. Predicting coronary artery disease using machine learning. Int J Stat Probab. 2024;13(2).
Basak S, Kar S, Saha S, Khaidem L, Dey SR. Predicting the direction of stock market prices using tree-based classifiers. N Am J Econ Finance. 2019;47:552-67.
Dahal KR, Budhathoki N, Dahal A, Dhital S. Comparative performance of machine learning models for diabetes prediction among US adults using NHANES data. Int J Stat Probab. 2026;15(1).
Shrestha PM, Lamichhane P. Effect of firm-specific variables on stock returns: Evidence from Nepal. Quest J Manag Soc Sci. 2022;4(2):249-59.
Shrestha PM, Lamichhane P. Macroeconomic factors and stock market performance in Nepal. PYC Nepal J Manag. 2021;14(1):79-92.
Bird S. NLTK: the natural language toolkit. In: Proc COLING/ACL 2006 Interactive Presentation Sessions. 2006. p. 69-72.
Hutto C, Gilbert E. Vader: A parsimonious rule-based model for sentiment analysis of social media text. In: Proc Int AAAI Conf Web Soc Media. 2014;8:216-22.
Loria S, et al. TextBlob documentation. Release 0.15. 2018;2(8):269.
Bonta V, Kumaresh N, Janardhan N. A comprehensive study on lexicon-based approaches for sentiment analysis. Asian J Comput Sci Technol. 2019;8(S2):1-6.
Aljedaani W, Rustam F, Mkaouer MW, Ghallab A, Rupapara V, Washington PB, Lee E, Ashraf I. Sentiment analysis on Twitter data integrating TextBlob and deep learning models: The case of the US airline industry. Knowl-Based Syst. 2022;255:109780.
Al-Natour S, Turetken O. A comparative assessment of sentiment analysis and star ratings for consumer reviews. Int J Inf Manag. 2020;54:102132.
Liu B, et al. Sentiment analysis and subjectivity. In: Handbook of Natural Language Processing. 2nd ed. 2010. p. 627-66.
Dahal KR, Gupta A, Budhathoki N. Comparative analysis of Vader and TextBlob on financial news headlines. J Data Sci. 2025;1-20.
Brownlee J. Better Deep Learning: Train Faster, Reduce Overfitting, and Make Better Predictions. Ebook. Machine Learning Mastery; 2018.
Hecke TV. Power study of ANOVA versus Kruskal-Wallis test. J Stat Manag Syst. 2012;15(2-3):241-47.
Shapiro SS, Wilk MB. An analysis of variance test for normality (complete samples). Biometrika. 1965;52(3-4):591-611.
McKight PE, Najab J. Kruskal-Wallis test. Corsini Encycl Psychol. 2010;1-1.
McKnight PE, Najab J. Mann-Whitney U test. Corsini Encycl Psychol. 2010;1-1.


 Scan and get link