IGMIN: We're glad you're here. Please click 'create a new query' if you are a new visitor to our website and need further information from us.
If you are already a member of our network and need to keep track of any developments regarding a question you have already submitted, click 'take me to my Query.'
Welcome to IgMin Research – an Open Access journal uniting Biology, Medicine, and Engineering. We’re dedicated to advancing global knowledge and fostering collaboration across scientific fields.
At IgMin Research, we bridge the frontiers of Biology, Medicine, and Engineering to foster interdisciplinary innovation. Our expanded scope now embraces a wide spectrum of scientific disciplines, empowering global researchers to explore, contribute, and collaborate through open access.
Welcome to IgMin, a leading platform dedicated to enhancing knowledge dissemination and professional growth across multiple fields of science, technology, and the humanities. We believe in the power of open access, collaboration, and innovation. Our goal is to provide individuals and organizations with the tools they need to succeed in the global knowledge economy.
IgMin Publications Inc., Suite 102, West Hartford, CT - 06110, USA
Here, we review what is known about the distribution of accessible H2O on Mars. While “Accessible” in this review implies within about 5 m of the surface, at an elevation at least 2 km lower than the MOLA Datum, and at a latitude within ±20°, possibly extendable to ±30°, we have extended our review to cover observations of H2O at moderate depth within the latitude range ±60°.
Twenty years ago, the neutron spectra and initial ice stability models suggested that ground ice on Mars was likely to be rare equatorward of about 50° latitude. Since then, observation after observation from orbit (using radar, photography and spectroscopy) revealed the likely presence of huge amounts of imbedded ice within the subsurface of Mars, at various depths mostly at so-called “mid-latitudes”. As a result, the pendulum has swung to the point that some enthusiastically suggest that ground ice occurs almost everywhere on Mars. We reviewed the various observations and analyses regarding H2O on Mars. Near-surface ice has been observed, spectra and radar have implied, and ground features have been interpreted to indicate that in wide areas of Mars, shallow ice apparently occurs at latitudes greater than 40° and at a few locations, persists into the 30s. The depths of such putative ice are not well known. Further study with much higher resolution might possibly reveal shallow ice at lower latitudes in unique locations. Mineral hydrates might offer a possible alternative as a supply of H2O.
The search for H2O on Mars has been motivated by scientific investigation into the role (past and present) of H2O in the functioning of the atmosphere-land system, as well as water as a necessary element for life (past or present), and (less often) more pragmatically as a source of support for human missions to Mars via life support and propellant production. In the past couple of decades, many exciting new discoveries were made of widespread H2O on Mars. This generated an aura of enthusiasm for the belief that accessible H2O is there for the finding almost everywhere on Mars. However, much of the “discovered” H2O is based on geological inference from surface formations or radar readings, much of it lies outside the realm of practical use, and still requires verification by “ground truth”.
In this review, we concentrate on the search for H2O that is accessible for utilization by human missions to Mars. In that connection, the three central parameters that guide us as to the which deposits are useful are: (1) latitude, (2) depth, and (3) elevation. In addition, we do not distinguish between the state of the H2O, whether it be ice or mineral hydrates and the depth and ease of extraction. Golombek, et al. [11Golombek M, Williams N, Wooster P, et al. SpaceX Starship landing sites on Mars. 52nd Lunar and Planetary Science Conference 2021. 2022; (LPI Contrib. No. 2548).] allowed for higher latitudes up to 40°N as accessible, and they added several other requirements that we did not consider here.
The mission system effects of latitude of landing site on a human mission to Mars do not seem to have been investigated in depth. There is no fixed range of latitude that is widely regarded as acceptable for human missions. Golombek, et al. [11Golombek M, Williams N, Wooster P, et al. SpaceX Starship landing sites on Mars. 52nd Lunar and Planetary Science Conference 2021. 2022; (LPI Contrib. No. 2548).] and Viola, et al. [22Viola D, McEwen AS, Dundas CM. Mid-latitude Martian ice as a target for human exploration, astrobiology, and in-situ resource utilization. First Landing Site/Exploration Zone Workshop for Human Missions to the Surface of Mars. 2015. Available from: https://www.hou.usra.edu/meetings/explorationzone2015/pdf/1011.pdf] considered sites around 39°N to be viable. We have been operating intuitively that ±20° is ideal and ±30° might be acceptable. Some factors that favor equatorial locations are:
(1) Even though solar power is likely to be a secondary source of power, it might be an important backup and useful for outlying locations.
(2) While local air temperatures are more dependent on thermal inertia than latitude, other factors being equal, temperatures near the equator are expected to warmer. Stress on thermal and structural design and control of habitats, rovers, etc. would be less near the equator.
(3) Seeing the (weak) sun would have remarkable psychological benefits for the crew. At 40° latitude, the (weak) sun is only 25 degrees above the southern horizon on Dec. 21.
(4) There are several factors regarding entry, descent and landing (EDL) and ascent trajectories and propellant requirements. Ascent propulsion at lower latitudes requires less propellant.
(5) The changes from season to season are less at lower latitudes - allowing thermal and energy management design to be simpler.
The appropriate range of acceptable latitudes for a landing site remains a point of controversy.
There is also no firm maximum acceptable depth of the resource, but the closer to the surface the better. Obviously, resources right at the surface are ideal. Ice or mineral resources at depths to perhaps 5 m ought to be accessible in the near term. Hydrated mineral resources on the surface would be ideal. In a distant, hypothetical SpaceX large-scale settlement, drilling down 500 m might even be conceptually possible. For our purposes, thinking about the first human mission to Mars, we focus on resources in the upper 5 m.
Sites with elevation at least 2 km lower than the average elevation on Mars (MOLA Datum) are greatly preferred to enhance entry, descent and landing (EDL). The Golombek, et al. [11Golombek M, Williams N, Wooster P, et al. SpaceX Starship landing sites on Mars. 52nd Lunar and Planetary Science Conference 2021. 2022; (LPI Contrib. No. 2548).] study listed potential sites ranging from -3 km to -3.9 km relative to the MOLA Datum.
In summary, “accessible” in this review suggests within about 5 m of the surface, at an elevation at least 2 km lower than the MOLA Datum, and at a latitude within ±20°, possibly extendable to ±30°. In addition, the deposit must yield large amounts of water (up to 1,000 MT for the near-term SpaceX mission, and a great deal more for futuristic scaled-up “settlement” missions).
Nevertheless, we reviewed the observations of H2O on Mars ranging from 60°S to 60°N for completeness, since not firm limits on latitude of landing site exist.
Against our limited criteria, many of the apparent discoveries of ice on Mars, though scientifically very interesting, are of dubious practical value. One example is the deposits interpreted by orbital radar to be vast deposits of ice in the Medusae Fossae Formation (MFF) located on Mars at 12°S–12°N, straddling the equator. This formation, if it is verified to be subsurface ice, would consist of a multi-layer ice-poor upper layer some 300 m to 600 m thick, overlying a thick ice-rich layer. (See Section 5.2). While it is not impossible to conceive of drilling down 300 m or more to access ice, the likelihood of this in the first human mission to Mars seems remote. This vast source of H2O seems unlikely to have practical value this century.
It is unfortunate that some observational reports do not provide information on the latitude and depth of overlayer for the deposits, and the elevation at the site is rarely mentioned. The term “mid-latitudes” is widely used but remains unclear as to the range of latitudes which leads to confusion in interpreting data.
In some cases, ice is observed directly on the surface of Mars by photography. Use of radar infers buried ice because of the dielectric constant of the material, as well as discontinuities revealing layers. The neutron spectrometer detects hydrogen in the top ~1 m, whether due to ice or mineral hydrates. Mineral hydrates contain considerable H2O tied up in their crystal structures. Use of the term H2O covers several possibilities.
NASA’s approach to exploration of Mars has been primarily to search for evidence of past or present life by estimating when and where liquid water flowed in the past, and by landing several rovers to explore a few local areas (range: ~20 km). Most of the planet remains unexplored in any detail. Lacking any serious NASA search for water on Mars, scientists came up with innovative methods to utilize instruments on Mars orbiters to observe or infer water on Mars (neutron spectrometer, radar, visual photography, IR spectroscopy). They were fortunate to observe some outcroppings of ice and surface indications of buried ice by photography – a windfall for the MRO camera. These approaches generated considerable information, yet our accumulated knowledge remains fragmentary and unverified by “ground truth”.
In this review, we attempted to assess what we have learned so far about accessible H2O from the various observations and analyses. Today, the general mood is very optimistic. H2O has been discovered in many locations. But science must be skeptical by nature. We must appraise each claimed discovery of a resource according to its uncertainty, and second according to three basic criteria: (1) latitude, (2) depth, and (3) elevation. That suggests that many indicated resources might not be practical for utilization. The search for accessible H2O on Mars is in its infancy. Much of the accessible H2O remains to be discovered.
For the future, the advent of the Starship offers the possibility of a hundred-fold increase over the present capability for landing payload mass [33Rapp D. Will SpaceX send humans to Mars in 2028? IgMin Res. 2024 Dec 13;2(12):969-983. IgMin ID: igmin274. doi: 10.61927/igmin274. Available from: igmin.link/p274,44Rapp D. Preparing for SpaceX mission to Mars. IgMin Res. 2025 Mar 4;3(3):123-132. IgMin ID: igmin292. doi: 10.61927/igmin292. Available from: igmin.link/p292]. Using this immense increase in payload offers the possibility of wide synoptic exploration of Mars. We could imagine a mission where the Starship provides a main landing site with an Earth-equivalent laboratory establishment, and a human crew controlling dispersed rovers that examine local areas and send data back to the main site via communication satellites around Mars. The rovers would be controlled with almost no time delay. To explore the vast surface of Mars, NASA would have to adopt two new priorities: (1) Search for accessible H2O to enable production of propellants via ISRU for crew return, and (2) Long distance travel across the surface of Mars by robots or crew. This would enable delivery of samples from wide swaths of Mars to the main site. Alternatively, we could imagine a Starship in low Mars orbit dropping many penetrators into key locations on Mars and observing whether ice occurs in the ejecta.
2. History of ice transport on mars over one million years
Rapp [55Rapp D. Human Missions to Mars. 2nd ed. 2012; 3rd ed. 2023. Heidelberg (Germany): Springer-Praxis Books; Springer. Appendix A: Solar energy on Mars. Appendix C: Water on Mars.] estimated the insolation on horizontal and tilted surfaces for various northern and southern latitudes of Mars over the last million years. Periods of high obliquity increase solar intensities at high latitudes and decrease solar intensities at equatorial latitudes. The percentage effect is much greater at high latitudes. At 80° latitude, the variation in insolation on horizontal surfaces spans almost a factor of three over the obliquity/eccentricity/precession cycle. The variation in equatorial insolation is only about 12%. The difference between the northern and southern highs and lows of insolation is due to the precession of the equinoxes, which continuously changes Lmin (the value of solar longitude (Ls) at which Mars is closest to the Sun). This reversal of which pole is closer to the sun continued throughout the history of Mars with a 51,000-year period.
Rapp [55Rapp D. Human Missions to Mars. 2nd ed. 2012; 3rd ed. 2023. Heidelberg (Germany): Springer-Praxis Books; Springer. Appendix A: Solar energy on Mars. Appendix C: Water on Mars.] showed that the orbit of Mars underwent large variations during the past million years. The most important factor was the variation in obliquity, but variations in eccentricity and periodic precession of the equinoxes are also relevant. Such variations would produce major changes in the distribution of solar energy input to Mars as a function of latitude, potentially resulting in redistribution of H2O resources across the wide latitudes of Mars.
A comparison of insolation at the equator on a horizontal surface summed over a Martian year with a high southern latitude and a high northern latitude over the past million years is given in Figure 1 [55Rapp D. Human Missions to Mars. 2nd ed. 2012; 3rd ed. 2023. Heidelberg (Germany): Springer-Praxis Books; Springer. Appendix A: Solar energy on Mars. Appendix C: Water on Mars.]. The alignment of peaks and troughs at high northern and southern latitudes depends upon the precession of the equinoxes. When Mars is closer to the sun in northern summer, the northern peak is higher, and when Mars is closer to the sun in southern summer, the southern peak is higher. Peaks at higher latitudes are aligned with troughs at equatorial latitudes. Water vapor driven off at high latitudes is captured at equatorial latitudes.
Figure 1: Comparison of insolation on a horizontal surface summed over a Martian year at the equator (0) with a high southern latitude (80°S) and a high northern latitude (80°N). Red arrows show flow of H2O vapor from high latitude toward the equator and blue arrows show return of H2O vapor from equatorial region to high altitudes [55Rapp D. Human Missions to Mars. 2nd ed. 2012; 3rd ed. 2023. Heidelberg (Germany): Springer-Praxis Books; Springer. Appendix A: Solar energy on Mars. Appendix C: Water on Mars.]. Provided by D. Rapp.
Mellon and Jakosky [66Mellon MT, Jakosky BM. The distribution and behavior of Martian ground ice during past and present epochs. J Geophys Res. 1995;100:11781-11799.] extended their landmark 1993 work on the history of water transport on Mars by including a consideration of orbital oscillations and found that moderate changes in the Martian obliquity can shift the geographic boundary of stable ground ice from the equator (global stability) up to about 70° latitude. They also found that diffusion of water vapor is rapid enough to cause similarly dramatic changes in the presence of ground ice at these locations on time-scales of thousands of years or less. It was estimated that the ice content of the upper 1 to 2 m of the soil can vary widely due to exchange of atmospheric water at rates faster than the rate of change of Mars obliquity. They provided an analysis of the behavior of near-surface ground ice on Mars through many epochs of varying obliquity during the past million years. They pointed out that the Mars climate undergoes two major responses to changing obliquity: (1) temperature change due to redistribution of insolation vs. latitude, and (2) increased summertime water sublimation from polar caps during higher obliquity, thus increasing the atmospheric water abundance and affecting the rate and direction of diffusive transport of water vapor in exchange with regolith at various latitudes. It turns out that the increase in atmospheric water abundance is more important than the temperature changes in regard to deposition of ground ice at equatorial and mid-latitudes. A comprehensive thermal/diffusion model allowed mapping out ground ice formation and depletion as a function of depth, latitude and Mars orbital history. Their model described regions and time periods where ice is stable, as well as regions and time periods where ice is not stable, but previously deposited ice remains residual because insufficient time has passed to allow it to sublime. They assumed 40% regolith porosity, allowing a maximum of 0.37 g/cm3 of ice to accumulate.
Transfer of water vapor sublimated from polar areas to equatorial regions is a rapid process compared to the rate of variation of obliquity (many thousands of years). Therefore, it was assumed that an increase in polar sublimation rate is matched by an equivalent increase in mean atmospheric water vapor abundance. They estimated that the atmospheric water content varied by four orders of magnitude when the obliquity varied from 10° to 40°.
According to this model, the mean atmospheric water vapor abundance would be about 35 times greater at an obliquity of 32° than it is today at 25.2°. This raises the frost point from ~ 195 K to ~218 K, and the model allows stable deposition of ice in the regolith at all latitudes. Because of the non-linear dependence of water vapor pressure on temperature, and the direct dependence of diffusion on the water vapor pressure at the surface, when Mars enters into a period of increasing obliquity, the model predicts a relatively rapid spread of ground ice into lower latitudes, culminating in planet-wide stable ground ice at very high obliquities. Subsequently, as the obliquity diminishes with time, the near-surface ground ice is gradually depleted due to sublimation. Therefore, during the past million years, it was concluded that there were periods of widespread ice stability alternating with periods where ice is stable only at high latitudes. Because oscillations of the obliquity of Mars have been relatively small during the past 300,000 years, this period has been marked by unusual stability.
Mellon and Jakosky [66Mellon MT, Jakosky BM. The distribution and behavior of Martian ground ice during past and present epochs. J Geophys Res. 1995;100:11781-11799.] found that "ice accumulates more rapidly during high obliquity than can be lost during low obliquity". Therefore, their curves of depth to the ice table tend to have a characteristic sharp reduction during the early stages of high obliquity, with a longer "tail" extending out as the obliquity diminishes. This appears to be due to the low subsurface temperatures that reduce the vapor pressure and rate of diffusion as the obliquity diminishes. The study provides a great amount of data and it is difficult to summarize all of their findings succinctly. They estimated the regions of ground ice stability and the depths of the ice table as a function of obliquity.
The Mellon and Jakosky study dealt mainly with ground ice that is transported from the polar caps via water vapor through the atmosphere. A permanent layer of such ground ice would be built up below the upper desiccated layer by deposition from the atmosphere to the depth of the seasonal thermal wave where the ground temperature is lower than the air temperature, causing condensation of water vapor in the pores of the regolith. This thermal wave may penetrate perhaps up to several meters. Below that level, the geothermal gradient takes over and the temperature slowly increases with depth, removing the driving force for deposition from the atmosphere. The study concluded that if ice fills the pores of the regolith below this level, it must be ice that was emplaced there a long time ago, and is not part of the periodic exchange process between polar caps and near-surface regolith. At sufficient depths, the temperature will exceed 273 K, and it is possible that liquid water might exist at such depths. However, it would appear that in that case, water vapor rising from these depths will condense out in the sub-freezing regolith below ~ 10 m depth, filling the entire subsurface with ground ice down to the point where T > 273 K. It was suggested that in the pattern of variable obliquity over the past million years, during a period of high obliquity, "diffusion is sufficiently rapid to fill the pore space in the near-surface regolith completely with ice in just a few thousand years." Conversely, as the obliquity falls, they found that "sublimation can be seen to remove ice down to about a meter before the obliquity completes a cycle and again begins to rise." At a latitude of around 50°, they found a steady build-up of subsurface ice in which each period of high obliquity deposits more ground ice than each period of low obliquity removes ice. It is also noted that it is possible that during periods when large amounts of water are alternately ingested and released by the regolith as ice, a cyclic inflation and deflation of the surface might cause small-scale surface features observed on Mars from orbit.
The following conclusions summarize our interpretation of their findings:
While the specific details of the calculations may not be exact due to simplifying assumptions made in the model, the general trends appear valid.
When the obliquity is less than about 22°, ground ice is unstable over most of the region between –60° and +60° latitude.
When the obliquity is greater than about 30°, the model indicates that ground ice is stable over most of the region between –60° and +60° latitude, and the depth to the ice table tends to be a few tens of cm.
As the obliquity increases from about 26.5° to 29.5°, the model indicates that the region of ground ice stability in the temperate zone expands greatly and the depth of the ice table drops from > 100 cm to a few tens of cm. This is a very sensitive region where small changes in obliquity produce large changes in water ice distribution.
The present obliquity of 25.2° lies just below the region of high sensitivity, and if the obliquity increases during the next hundred thousand years, it may cause very significant changes in the water distribution on Mars.
The alternating cycles of obliquity tend to deposit deeper ice below about a meter in depth at intermediate latitudes (45–55°). This produces a long-term build-up of ground ice to the present day, even though ground ice is not thermodynamically stable presently. This build-up does not occur at lower latitudes.
The arguments presented above would suggest that ice would have been widely deposited in the regolith of Mars over long periods, and has been slowly escaping from the near surface over the past ~300,000 years. The question of persistence or loss of ground ice over the past ~ 300,000 years when the Mars orbital parameters were relatively stable is discussed in the next section.
Chamberlain and Boynton [77Chamberlain MA, Boynton WV. Modeling depth to ground ice on Mars. Lunar Planet Sci XXXV. 2004; Paper 1650.] investigated conditions under which ground ice could be stable on Mars based on the history of changing obliquity of the Mars orbit. They combined a thermal model with a water-vapor diffusion model. The thermal model estimated the temperatures at different depths in the subsurface at different times of the Martian year. Temperatures are functions of latitude, albedo and thermal inertia. The thermal model can determine a depth to stable ice. Ice is stable if the top of the “ice table” has the same average vapor density as the average water vapor density in the atmosphere. H2O is allowed to move by the vapor diffusion model. The temperatures from the thermal model are used to partition water between 3 phases: vapor, adsorbed and ice. Vapor is the only mobile phase and the diffusion of vapor is buffered by adsorbed water. Vapor diffusion models can have ice-poor or ice-rich starting conditions. Vapor diffusion models are run for long periods to check the long-term evolution of depth to stable ice. As ice distribution in the ground changes, the thermal properties of the ground change too. Thermal conductivity increases as ice fills the pore spaces. Vapor diffusion models are run iteratively with thermal models to update the temperature profiles as ice is re-distributed. In one set of results, Chamberlain and Boynton presented data on stability of ground ice vs. latitude for various Mars obliquities. As we pointed out, the obliquity of Mars varied considerably in the past. Two sets of ground properties were utilized:
Figure 2: Minimum depth to stability of ground ice vs. latitude for various Mars obliquities (a) upper figure: for bright dusty ground, and (b) lower figure: for dark rocky ground. Adapted from Figure 1 of Chamberlain and Boynton [77Chamberlain MA, Boynton WV. Modeling depth to ground ice on Mars. Lunar Planet Sci XXXV. 2004; Paper 1650.].
These results suggest that ground ice is not stable in the current climate at equatorial latitudes due to the low obliquity. However, as the obliquity is increased, a point is reached (depending on the soil properties) where a discontinuous transition occurs from instability to stability of ground ice. According to this model, this transition occurs between 25° and 27° for bright dusty ground, and between 29° and 31° for dark rocky ground. With the present obliquity at 25.2°, ground ice is not stable at equatorial latitudes. As Rapp [55Rapp D. Human Missions to Mars. 2nd ed. 2012; 3rd ed. 2023. Heidelberg (Germany): Springer-Praxis Books; Springer. Appendix A: Solar energy on Mars. Appendix C: Water on Mars.] showed, there were several periods in the past million years when the obliquity reached 35°. Even in the stable period of the past ~300,000 years, the obliquity reached 30°, and was as high as 27° only ~80,000 years ago. During those periods, solar energy input to equatorial regions was significantly reduced in winter and solar energy input to high latitudes was significantly increased in summer. It seems likely that there must have been a major transfer of near-surface ice from the high latitudes to the temperate latitudes during these epochs. The obliquity has been ≤ 25.2° over the past ~50,000 years, implying that the subsurface ice deposited in earlier epochs has been subliming, receding, and transferring to polar areas. However, these processes would be inhibited by dust and regolith in some localities. Therefore, it is possible that in some regions, particularly very bright, low thermal inertia regions at low to moderate latitudes, some of this vestigial subsurface ice from former epochs may possibly remain even today, particularly on surfaces tilted toward the poles.
Chamberlain and Boynton [77Chamberlain MA, Boynton WV. Modeling depth to ground ice on Mars. Lunar Planet Sci XXXV. 2004; Paper 1650.] carried out an updated model of extent of near-surface ice for different ancient epochs. They modeled the atmospheric water content for different epochs on the basis of the water carrying capacity of the atmosphere over surface ice, including s a technique to correct the water vapor density just above the surface for depletion due to nighttime frost, reducing the effective water vapor density in contact with ground ice. This reduced the spread of ice to lower latitudes even at high obliquity compared to previous models. An approximate interpretation of their results is given in Figure 3. The values for obliquity = 25° are appropriate for current conditions. At a high obliquity of 35°, ice can be stable down to fairly low latitudes in the North, but not at the equator.
Figure 3: Approximate interpretation Figure 10 of Chamberlain and Boynton [88Chamberlain MA, Boynton WV. Response of Martian ground ice to orbit-induced climate change. J Geophys Res Planets. 2007;112. doi: 10.1029/2006JE002801.]. The curves show the extent of ice stability for two levels of obliquity.
Note: In several of our figures, the longitude is given as -180° to +180°, whereas it is now conventional to use 0° to 360°. We used the designation as given by the authors.
A recent study of the history of ancient water on Mars carbonate formation and surface liquid-water availability are linked by negative feedback that suggests intermittent water “oases” on Mars rather than widespread and persistent water [99Kite ES, Tutolo BM, Turner ML, Franz HB, Burtt DG, Bristow TF, Fischer WW, Milliken RE, Fraeman AA, Zhou DY. Carbonate formation and fluctuating habitability on Mars. Nature. 2025 Jul;643(8070):60-66. doi: 10.1038/s41586-025-09161-1. Epub 2025 Jul 2. PMID: 40604181; PMCID: PMC12221984.]. This potentially explains the time span, intermittency and patchiness of oases on Mars; the locations and total volume of the sedimentary rocks that entomb those oases; the end of surface habitability on Mars; and the isotopic composition of Mars’s atmosphere. After 3.5 Ga, carbonate formation can regulate the size and duration of oases on Mars.
We have shown in the previous section that great amounts of ice were estimated to have been deposited in the ±60° latitude range in the distant past, and recent observations confirm that some of that vestigial ice remains in the subsurface and near surface of Mars at various locations.
Skorov, et al. [63.63.Gourronc M, Bourgeois O, Mège D, et al. One million cubic kilometers of fossil ice in Valles Marineris: relicts of a 3.5 Gy old glacial land system along the Martian equator. Geomorphology. 2014;204:235–255. doi:10.1016/j.geomorph.2013.08.009.] showed that dusty areas with low thermal inertia enhance the stability of ground ice, at least in upper-mid latitudes.
Mellon and Phillips [1111Mellon MT, Phillips RJ. Recent gullies on Mars and the source of liquid water. Abstracts of Papers Submitted to the 32nd Lunar and Planetary Science Conference. Houston (TX): Lunar and Planetary Institute; 2001. CD 32, Abstract 1182.] assumed average values for soil properties and atmospheric water content. Based on this, their model indicated that under current Mars conditions, the slope of the surface has a strong effect on the ice table depth in this latitude range. They estimated the depth of the ice table for various slopes and latitudes. They also explored the dependence on the obliquity of the Mars orbit to infer what might have happened in past epochs. They found that when the obliquity exceeds about 31°, there is a rather abrupt transition to a stable ice table at 30°S at a depth of about 2 meters. At higher obliquities, the model indicates that ice table is shallower and exists at all latitudes.
Schorghofer and Aharonson [1212Schorghofer N, Aharonson O. Stability and exchange of subsurface ice on Mars. Lunar Planet Sci XXXV. 2004; Paper 1463. Schorghofer N, Aharonson O. Stability and exchange of subsurface ice on Mars. Journal of Geophysical Research. 2005;110:E05003.] carried out an analysis of subsurface ice stability. Their work included two parts: (1) depth of the ice table vs. latitude at equilibrium, and (2) rate of change of subsurface due to changing surface conditions. Model predictions were made for ground ice in thermodynamic equilibrium with the water vapor in the present atmosphere. Temperatures were obtained with a one-dimensional thermal model of the subsurface, using a thermal inertia map, an albedo map, orbital elements, and partial surface pressures obtained from the Thermal Emission Spectrometer over a Martian year. They found that the depth of the ice table ranged from about 20 g/cm2 at 85° latitude to 50 g/cm2 at 70° latitude, to about 100 g/cm2 cm at 60° latitude, and then the depth of the ice table plunged at lower latitudes. These depths in g/cm2 can be converted to linear distance if a density is assumed. For example, if the density is assumed to be 1.5 g/cm3, the depth in cm is the depth in g/cm2 divided by 1.5. They estimated that due to the rapid exchange of water vapor between the atmosphere and the subsurface, small amounts of subsurface frost will accumulate during the cold season down to latitudes of 25°, in a layer below the penetration depth of diurnal temperature variations and above the penetration depth of seasonal variations. Figure 4 shows that in the regions where they estimated that subsurface ice is not stable year-around, it may be stable for part of a year, particularly where the thermal inertia is low. It can be seen that all of the Mars landers so far except VL-2, landed in regions of high thermal inertia where subsurface ice is never stable.
Figure 4: Fraction of a year for which frost point is higher than subsurface temperature. Background shading shows regions of high thermal inertia. Mars landing sites are shown as circles. The vertical scale is latitude. Adapted from Figure 13 of Schorghofer and Aharonson [].
Mellon, Feldman and Prettyman [1313Mellon M, Feldman W, Prettyman T. The presence and stability of ground ice in the southern hemisphere of Mars. Icarus. 2004 Jun;169(2):324-340. doi:10.1016/j.icarus.2003.10.022.] also carried out an analysis of ice stability at various latitudes. They made new estimates of ground-ice stability and the depth distribution of the ice table and compared these theoretical estimates of the distribution of ground ice with the observed distribution of leakage neutrons measured by the Neutron Spectrometer instrument of the Mars Odyssey spacecraft’s Gamma Ray Spectrometer instrument suite. Their calculated ground-ice distributions were based on improvements over previous work in that (1) they included the effects of the high thermal conductivity of ice-cemented soil at and below the ice table, (2) they included the surface elevation dependence of the near-surface atmospheric humidity, and (3) they utilized new high-resolution maps of thermal inertia, albedo, and elevation from Mars Global Surveyor observations. All of their results scale with the fundamental (but still uncertain) parameter: the global annual average precipitable water vapor. Comparison of their results with neutron spectrometer results from Mars Odyssey suggests that this parameter is between 10 and 20 pr µm with outer bounds of 5 and 30 pr µm. For the case of 10 pr µm, their results indicate that the ice table reaches ~1 m depth at latitudes northward of 50 ± 5° north latitude, and southward of 55 ± 5° south latitude. If the global annual average water vapor concentration is as high as 20 pr µm, the latitudes where the ice table is at 1 m depth would shift about 4° toward the equator.
Vincendon, et al. [1414Vincendon M, Mustard J, Forget F, et al. Near-tropical subsurface ice on Mars. Geophysical Research Letters. 2010. doi:10.1029/2009GL041426.] used various modeling hypotheses and reached the conclusion that water ice is present within one meter of the surface on all 20°–30° pole facing slopes down to about 25°S. Note that 20°–30° slopes are extreme, and are unlikely to be practical for a landing site. The model depends on the fact that CO2 ice is not observed to persist down to these levels, suggesting a heat source that they attribute to hypothetical near-surface ice.
Mellon and Sizemore [1515Mellon MT, Sizemore HG. The history of ground ice at Jezero Crater Mars and other past, present, and future landing sites. Icarus. 2022;371:114667. doi:10.1016/j.icarus.2021.114667.] modeled ground-ice stability in the upper meters of the soil on Mars for the past 2.5 Myrs at relevant sites. They concluded that in the geologic past, ground ice was likely globally stable and present in the top 10 cm of the soil as recently as 500 kyrs ago. They concluded that ground ice may be stable today for conditions that favor cooler ground temperatures. These conditions include high pole-facing slopes and soils that exhibit high albedo and low thermal inertia. Where ground ice is unstable, relict ground ice may persist in a state of disequilibrium tens of meters below the surface.
Lange, et al. [1616Lange L, Forget F, Vincendon M, Spiga A, Vos E, Aharonson O, Millour E, Bierjon A, Vandemeulebrouck R. A reappraisal of subtropical subsurface water ice stability on Mars. Geophysical Research Letters. 2023. doi:10.1029/2023GL105177.] revisited earlier models of ice stability at sub-tropical latitudes (25° to 30°). They pointed out that ice is not expected to be stable on horizontal surfaces at these latitudes, “but could be stable on pole-facing slopes which have cold microclimates”. They developed a new model to examine this possibility. Their Figure 3 shows the theoretical stability of subsurface water-ice with respect to diffusion for flat surfaces and for pole-facing 30°slopes using a nominal near-surface humidity. While the exact contours of stability are subject to the uncertainties inherent in such models, the difference between a flat surface and a sloped surface is impressive and that difference is likely to be real. For pole-facing 30° slopes, the model predicts widespread stability at latitudes greater than 44°. It is also noteworthy that their Figure 3 indicates that for pole-facing 30° slopes, ice is never stable at 30° latitude, and only rarely stable below 40° latitude. As an aside, we mention that it is common in these contour plots to also show dots where ice was exposed by impacts or scarps as experimental evidence to go along with the theoretical model. However, that might create a false sense of prevalence of ice because 96% of the craters did not show ice, indicating that such exposures of ice are sporadic and scarcely distributed amongst dry areas [1717Daubar IJ, Dundas CM, McEwen AS, et al. New craters on Mars: an updated catalog. JGR. 2022. doi:10.1029/2021JE007145.]. It is also important to note that a 30° slope corresponds to a 58% grade, rarely occurs, and is unsuitable site for a human landing.
3.2 Summary
The obliquity of Mars is presently 25.2°. Over very long time periods, the obliquity of Mars in its orbit has varied widely, affecting the global stability of near-surface ground ice. Models indicate that there is a great sensitivity of stability of ground ice to the obliquity, and at some point, with obliquity above roughly 27°, ground ice can become widely stable, even at some temperate latitudes. Since the obliquity exceeded 30° in the past million years, models indicate that ground ice was likely deposited in the North down to as low as 10° to 15° latitude, and in the South as low as 30° latitude in that time period. The models utilize quantitative approximations and assumptions but there is little doubt that the trends are correct. Over the past 300,000 years, the obliquity of Mars has been relatively stable. During that period, ice embedded in the Mars regolith has been diffusing out, leaving behind a patchwork quilt of occasional deposits of remnant ice and dry soil, mostly depleted at low latitudes, and increasing in coverage at higher latitudes until ice is widely prevalent above perhaps 50° latitude, and scattered at various locations at lower latitudes, becoming less prevalent below 40° latitude.
The model results depend on the orientation and properties of the surface. Regions with low thermal inertia will retain ground ice longer. Equally important is the slope of the surface, and if steep and facing North, might preserve ancient deposits of ice to this day.
From a pragmatic point of view, the greatest interest is in residual near-surface ice within the ±30° latitude range where future human missions to Mars are likely to be based, and the closer to the equator, the better. However, some researchers are willing to stretch a point and even consider mission locations in the 35° to 40° latitude range [11Golombek M, Williams N, Wooster P, et al. SpaceX Starship landing sites on Mars. 52nd Lunar and Planetary Science Conference 2021. 2022; (LPI Contrib. No. 2548).].
The models are better at estimating where ice may have been stable in the distant past at higher obliquity but are not as good for estimating how much remains at low latitudes where ice is presently not thermodynamically stable, but might persist due to slow kinetics. Observations of indigenous H2O on Mars must be used to estimate current ice resources, and that will be reviewed in the next sections of this report.
4. Observations from orbit of near-surface hydrogen on mars
4.1 Mars odyssey neutron and gamma ray spectra – Introduction
The Mars Odyssey Orbiter carried neutron and gamma ray spectrometers for observation of Mars.
The following description is adapted from Boynton, et al. [1818Boynton WV, Feldman WC, Squyres SW, Prettyman TH, Bruckner J, Evans LG, Reedy RC, Starr R, Arnold JR, Drake DM, Englert PA, Metzger AE, Mitrofanov I, Trombka JI, D'Uston C, Wanke H, Gasnault O, Hamara DK, Janes DM, Marcialis RL, Maurice S, Mikheeva I, Taylor GJ, Tokar R, Shinohara C. Distribution of hydrogen in the near surface of Mars: evidence for subsurface ice deposits. Science. 2002 Jul 5;297(5578):81-5. doi: 10.1126/science.1073722. Epub 2002 May 30. PMID: 12040090.]:
Cosmic rays strike atomic nuclei in the matter in the surface of Mars, and generate neutrons by various nuclear reactions. The neutrons then lose energy by collision with surrounding nuclei, and thus excite other nuclei, which then de-excite by emission of gamma rays. After the neutrons lose enough energies to approach thermal energy, they can be captured by nuclei, which then also de-excite by emission of gamma rays. Some of the neutrons escape the planet’s surface and can be detected in orbit. The flux of these leakage neutrons is indicative of the amount of moderation and capturing of the neutrons. These processes are a function of the composition of the surface because different elements have different cross sections for capture and have different abilities to moderate neutrons. Hydrogen is especially effective at moderating neutrons because its mass is nearly the same as that of the neutron. Neutrons are conventionally divided into three different energy bands: fast, epithermal, and thermal.
These energy bands are thermal (energies less than 0.4 eV), epithermal (0.4 eV < E < 0.7 MeV), and fast (0.7 MeV < E < 1.6 MeV) neutrons.
By measuring the flux of neutrons in each energy band, it is possible to estimate the abundance of hydrogen in the upper ~ 1 meter of Mars, thus inferring the presence of water. However, the hydrogen will be obscured if there is a surface layer of carbon dioxide ice.
The neutron spectrometer (NS) (in orbit) returns several neutron spectra and a gamma ray spectrum about every 20 s, which is the equivalent of one degree of motion or 59 km over the surface. The data are then binned over regions of interest to improve statistics. For much of the data reduction, the data were binned in 5° latitude bands to improve signal-to-noise so the pixel size is effectively about 550 km. The data records only the abundance of hydrogen regardless of its molecular associations; however, the results are reported in terms of water-equivalent hydrogen (WEH) mass fraction (WEH is the weight percent (wt%) of water that the subsurface material would contain in the almost certain possibility that the detected hydrogen is present as some form of H2O – ice or mineral hydrates).
Relating this data to the actual distribution of H in the surface is not straightforward. If the flux of neutrons is constant and hydrogen is uniformly distributed with depth, then the concentration of hydrogen is directly proportional to the gamma ray signal strength. Since the hydrogen concentration can vary with depth, the relation between concentration and gamma signal is complex. Similarly, if there is a single layer with constant water content, the neutron fluxes can be estimated as a function of water content. However, if as is almost certain to be the case, vertical distribution of water content is variable, the dependence of gamma ray and neutron signals on the water distribution function is also complex. The raw data (counts) can only be converted to water content for a specific model of vertical distribution. For all models, it is assumed that the concentration of elements other than H was that of the soil measured by the Mars Pathfinder Alpha Proton X-Ray Spectrometer. In the original work, the results were normalized to unity for a soil with the equivalent of 1% H2O by weight at the location of Viking I. In subsequent work, normalization was accomplished by using counts from a polar area covered by a CO2 cap (that acts as a shield) as a "zero" base. This made a small change in the normalization (basically the 1% minimum rises to 2%).
The model used to process most of the data was a two-layer model in which a desiccated upper layer of thickness D containing 2% water by weight, covering an infinite slab containing X% water by weight. The neutron count rates can be estimated by detailed modeling for any values of X and D. There are two parameters involved, and in the more recent treatment, use was made of neutrons with different energy to attempt to resolve X and D.
4.2 Mars odyssey data reduction - Neutron spectroscopy
4.2.1 Introduction: Assuming a simple two-layer model, with the upper layer containing ~1% water, the fluxes of thermal and epithermal neutrons were modeled as a function of the thickness of the overburden of desiccated regolith (in g/cm2) for various settings of the water content (% by weight) in the lower layer [1818Boynton WV, Feldman WC, Squyres SW, Prettyman TH, Bruckner J, Evans LG, Reedy RC, Starr R, Arnold JR, Drake DM, Englert PA, Metzger AE, Mitrofanov I, Trombka JI, D'Uston C, Wanke H, Gasnault O, Hamara DK, Janes DM, Marcialis RL, Maurice S, Mikheeva I, Taylor GJ, Tokar R, Shinohara C. Distribution of hydrogen in the near surface of Mars: evidence for subsurface ice deposits. Science. 2002 Jul 5;297(5578):81-5. doi: 10.1126/science.1073722. Epub 2002 May 30. PMID: 12040090.]. A similar set of curves was generated for the upper level containing 2% water. It was found that the 2% curves fit data better at higher latitudes and the 1% curves fit better at lower latitudes. For high latitudes, the data indicated a lower layer water concentration of perhaps 35%. The thickness of the upper layer appeared to vary typically from about 20-50 g/cm2 at higher latitudes (60 - 80°) to over 100 g/cm2 at 40° latitude.
Further analysis provided a revised procedure for data reduction [1919Feldman WC, Prettyman TH, Maurice S, et al. Global distribution of near-surface hydrogen on Mars. J Geophys Res. 2004;109:E09006.]. It was necessary to remove data that was contaminated by seasonal deposits of CO2 frost, by separating the total data set into three parts. The data measured before the autumnal equinox in the south (corresponding to an areocentric longitude of Ls ~ 0) was used to generate the portion of the data set poleward of about 60°S latitude. A similar procedure for the northern boundary used data measured after Ls = 100. Data within the middle band of latitudes (~-60° to +60°) was averaged over the entire data set. Correction of all counting rates for variations in cosmic ray flux, global variations in atmospheric thickness. Corrections were also made for variations in atmospheric thickness due to topography at mid-latitudes.
The initial analysis normalized the data against the Viking I site data that indicated ~1% water content in the upper layer. In that work it was found that data fits to models were best when the upper layer had about 1% water content at mid-latitudes and about 2% water content at higher latitudes. In the new analysis, calibration was made against areas covered with CO2 ice that should have no hydrogen signal, and this led to adoption of a uniform 2% water content for the upper layer at all locations.
As before, both a single layer and a two-layer model were utilized. The two-layer model utilized an upper layer of depth D (g/cm2) with 2% water content by weight, and a lower layer of infinite thickness containing X% water by weight. Since the neutron data are not sensitive to depths deeper than ~ 1–2 m, any assumptions made regarding water content below ~ 1–2 m are irrelevant. Unlike the initial analysis that used thermal and epi-thermal neutron data, the revised data analysis combined the data on epi-thermal and high-energy neutrons. Although a preliminary analysis showed that thermal neutrons should be more sensitive to burial depth than fast neutrons, the authors purposely avoided them at this point because a unique interpretation of thermal neutrons requires knowledge of the composition of surface soils (specifically, the abundances of the strongest neutron absorbers, Fe, Ti, Cl, Gd, and Sm). These abundances were not available to Mars Odyssey gamma-ray observations.
Based on the simple model of a uniform regolith (no layers) containing an unknown mass fraction of water, and utilizing only epi-thermal neutron data a global estimate of water content was made assuming that the lowest water concentration is ~ 2%, as shown in Figure 5 The effect of a two-layer model with 2% water in the upper layer on Figure 5 will lead to increased water concentrations in the lower layer compared to those estimated for a single layer. For middle latitudes (-45° to +45°) it was estimated that the correction to the data in Figure 5 is given by:
Water fraction (lower of two layers) = 0.998 (water fraction in figure) + 1.784 (water fraction in figure)2 + 0.000435.
For a region with say, 10% water according to the figure (water fraction = 0.10), the estimated water content of the lower layer in a two-layer model is
0.0998 + 0.0178 + 0.0004 = 0.118 or 11.8%.
This estimate was based on a 10 g/cm2 upper layer. If the upper layer is thicker, the correction would be greater.
We were unable to derive the uncertainties in these measurements. We suspect that the linearity of the scale is uncertain, and the lower values of WEH might not be as precise as the higher values?
Figure 5: Global variation of water content in upper ~ 1 m of Mars based on a uniform regolith model (no layers) using epi-thermal neutron data. Adapted from Figure 4 of Feldman, et al. 2004 [55Rapp D. Human Missions to Mars. 2nd ed. 2012; 3rd ed. 2023. Heidelberg (Germany): Springer-Praxis Books; Springer. Appendix A: Solar energy on Mars. Appendix C: Water on Mars.,1919Feldman WC, Prettyman TH, Maurice S, et al. Global distribution of near-surface hydrogen on Mars. J Geophys Res. 2004;109:E09006.].
4.2.2 Mars odyssey observed water content based on a two-layer regolith model at equatorial and mid-latitudes: A first-order approximation to the depth of burial of the lower H2O-containing layer can be made through a combined study of epithermal- and fast-neutron counting rates. Processing data from epi-thermal neutrons with an assumed uniform regolith model will underestimate the water content in the lower layer of a two-layer model. The fast-neutron indication of water content will be lower than the epithermal indication of water content because the fast signature of hydrogen drops off more rapidly with depth and generally, there is more water at depth than there is near the surface. As the thickness of the uppermost desiccated layer increases to a value greater than about 100 g/cm2, both the epithermal and fast neutron curves flatten out to a constant prediction of 2% H2O. In other words, a water-rich soil layer buried beneath a relatively desiccated layer can no longer be detected from orbit through measurements of escaping neutrons if its physical thickness is larger than about one meter.
Models were developed to define the relationship between the apparent mass fraction of H2O from measured fast neutron currents to that determined from measured epithermal as a function of water content in the lower layer and thickness of the upper layer. The results are provided in Figure 5. As Figure 5 shows, there are three places in the equatorial zone where the simple uniform regolith model predicts water mass fractions as high as ~ 10%. The two-layer model was used to elucidate more insight into these, and other equatorial and mid-latitude sites. For this purpose, the measured counting rates equatorward of ±45° were binned into 5° latitude quasi-equal area spatial elements (about 550 km x 550 km). The data analysis indicates that most of the water-equivalent hydrogen at near-equatorial latitudes is buried below a desiccated layer. The preponderance of data suggested an upper layer thickness of typically 10-20 g/cm2 with occasional locations going up to 40 or even 60 g/cm2.
Karunatillake, et al. [2020Karunatillake S, Wray JJ, Gasnault O, et al. Sulfates hydrating bulk soil in the Martian low and middle latitudes. Geophysical Research Letters. 2014;41(22):7987-7996. doi:10.1002/2014GL061136.] showed that the distribution of near-surface sulfates on Mars is similar to the distribution of H2O shown in Figure 5, suggesting that lower latitude H2O is likely to be due to sulfate hydrated minerals (rather than ice).
Pathare, et al. [2121Pathare AV, Feldman WC, Prettyman TH, Maurice S. Driven by excess? Climatic implications of new global mapping of near-surface water-equivalent hydrogen on Mars. Icarus. 2018;301:97-116. doi:10.1016/j.icarus.2017.09.031.] developed an updated analysis of the data. This data was plotted by Butcher [2222Butcher FEG. Water ice at mid-latitudes on Mars. In: Oxford Research Encyclopedia of Planetary Science. Oxford Research Encyclopedias. Oxford University Press; 2022. ISBN 9780190647926. doi:10.1093/acrefore/9780190647926.013.239.] as shown in Figure 6. When you compare Figures 5,6, they are quite similar but the later plot (Figure 6) shows a little more definition.
Figure 6: Simplified version of updated plot of Mars Odyssey data. Adapted from data in Figure 7 of Butcher [2222Butcher FEG. Water ice at mid-latitudes on Mars. In: Oxford Research Encyclopedia of Planetary Science. Oxford Research Encyclopedias. Oxford University Press; 2022. ISBN 9780190647926. doi:10.1093/acrefore/9780190647926.013.239.].
The acquisition of this synoptic data from Mars Odyssey represents a major step forward in our understanding of the distribution of near-surface hydrogen on Mars. Whether the data and ensuing analysis is sufficient to quantify water percentage is arguable, but as a minimum, the data distinguishes between areas heavily laden with ice, areas with moderate amounts of hydrogen (ice or mineral hydrates), and areas with minimal amounts of hydrogen. The areas with lower estimated percentages might be less accurate than the areas with higher percentages. The limitations due to the 550 km pixel size are significant in regions where there is a small but significant water equivalent percentage (~10%). It is impossible to distinguish between a broad field containing ~10% vs. several distributed localities with high concentration embedded in a background field with low percentage.
4.2.3 Interpretation of depth from mars odyssey neutron measurements: There is direct correspondence between the energy of a registered neutron and depth at which it was produced. The production rate of gamma rays from fast neutrons has a maximum at depths less than tens of centimeters while the epithermal neutrons originate from a layer 1-3 m below the surface. Combining measurements in epithermal energy range with measurements above 1 MeV, the water abundance distribution at different depths can be constructed starting from thin subsurface layer and going down to a meter or two in depth. This allows checking simple models describing the layered structure of the regolith.
To extract information on regolith structure from neutron data, Mitrofanov, et al. [2323Mitrofanov IG, Zuber MT, Litvak ML, Boynton WV, Smith DE, Drake D, Hamara D, Kozyrev AS, Sanin AB, Shinohara C, Saunders RS, Tretyakov V. CO2 snow depth and subsurface water-ice abundance in the northern hemisphere of Mars. Science. 2003 Jun 27;300(5628):2081-4. doi: 10.1126/science.1084350. PMID: 12829779.] implemented two typical types of regolith models. One used a homogeneous distribution of water with depth. The second utilized two layers with relatively dry (~2% of water) upper soil layer covering the lower water-rich layer. In the first model there was only one free parameter – water content. In the second model there were two free parameters: thickness of the upper layer and water content of the bottom layer. The calculations were restricted to selected high latitude provinces of Mars. Some wet equatorial regions inside Arabia Terra were also investigated to find regions of highest water content at equatorial latitudes, although no specific graphical data were presented for this case. The footprint size was typically 550 km × 550 km. They said that only the two-layer model fits the data.
Mitrofanov, et al. [2323Mitrofanov IG, Zuber MT, Litvak ML, Boynton WV, Smith DE, Drake D, Hamara D, Kozyrev AS, Sanin AB, Shinohara C, Saunders RS, Tretyakov V. CO2 snow depth and subsurface water-ice abundance in the northern hemisphere of Mars. Science. 2003 Jun 27;300(5628):2081-4. doi: 10.1126/science.1084350. PMID: 12829779.] mentioned data that provided estimates of depth to the ice-filled layer, and the water content of the ice-filled layer. The original paper where that data was published cannot be found but Rapp [55Rapp D. Human Missions to Mars. 2nd ed. 2012; 3rd ed. 2023. Heidelberg (Germany): Springer-Praxis Books; Springer. Appendix A: Solar energy on Mars. Appendix C: Water on Mars.] presented the data. Soil depths in the North Polar Region are small (0-15 g/cm2 above 70°N) and increase as the latitude is decreased. In the South, soil depths are a bit greater (15-20 g/cm2 pole-ward of 70°S) but water content is similar. However, the water content drops more sharply than in the north near 60° latitude.
4.2.4 More recent data processing of mars odyssey data: Wilson, et al. [2424Wilson JT, Eke VR, Massey RJ, et al. Equatorial locations of water on Mars: improved resolution maps based on Mars Odyssey Neutron Spectrometer data. Icarus. 2018;295:148. doi:10.1016/j.icarus.2017.07.028.] revisited the Mars Odyssey data and improved the map’s spatial resolution approximately a factor of two (from 550 km to ~ 275 km) via a new pixon image reconstruction technique. They presented maps of the near subsurface hydrogen distribution on Mars based on epithermal neutron data from the Mars Odyssey Neutron Spectrometer. They focused on a few locations that have been proposed to contain water deposited in the geologically recent past in equatorial regions of Mars. In the ±30° region, the higher resolution revealed some areas with more hydrogen than at lower resolution. However, even the highest hydrogen areas in the ±30° region appeared to be limited to about 10% to 12% WEH. There is no way to determine whether this is due to ice or mineral hydrates but it seems most like to be mineral hydrates from other considerations.
They also compared a local part of the synoptic orbital data around Gale crater to the data taken by the Dynamical Albedo of Neutrons (DAN) instrument on the Curiosity Rover [2525Mitrofanov IG, Litvak ML, Varenikov AB, et al. Dynamic Albedo of Neutrons (DAN) experiment onboard NASA’s Mars Science Laboratory. Space Sci Rev. 2012;170:559-582.].
They concluded that “at low and equatorial latitudes we found evidence, in the reconstruction of the MONS data, for buried water ice in the Medusae Fossae Formation and on the western slopes of the Tharsis Montes and Elysium Mons”. We think this conclusion is insupportable from the evidence.
The neutron spectroscopy WEH baseline is explained
Hydrated minerals and equatorial hydrogen are discussed,
Making it the right place to introduce additional mineral-chemistry mechanisms.
4.3 FREND Instrument: Evidence for unusually high hydrogen at equatorial sites
The FREND instrument (Fine Resolution Epithermal Neutron Detector) is installed onboard the Trace Gas Orbiter (TGO) of the Russian-European ExoMars mission, launched in 2016. Currently TGO's science orbit is circular with an altitude of 400 km and an inclination of 74°, thus the FREND does mapping of the surface between 74° latitude north and south. FREND's major new characteristic is its neutron collimator – a passive system significantly limiting the instrument's field of view (FOV). FREND has two detection systems with collimated FOV: Detection System for Epithermal Neutron (DSEN) and Detection System for Fast Neutrons (DSFN). The results reported by Malakhov, et al. [2626Malakhov AV, Mitrofanov IG, Golovin DV, et al. High resolution map of water in the Martian regolith observed by FREND neutron telescope onboard ExoMars TGO. Journal of Geophysical Research: Planets. 2022;127(5):e2022JE007258. doi:10.1029/2022JE007258.] were obtained from the DSEN data.
The major innovation of the FREND instrument is its collimator that shields detectors to a narrow field of view, thus producing maps with higher spatial resolution than were observed previously with omnidirectional neutron spectrometers. The results are reported as wt % water equivalent hydrogen (WEH). Because of the narrower field of view, the instrument had to observe longer to get sufficient counts per pixel.
Malakhov, et al. [2626Malakhov AV, Mitrofanov IG, Golovin DV, et al. High resolution map of water in the Martian regolith observed by FREND neutron telescope onboard ExoMars TGO. Journal of Geophysical Research: Planets. 2022;127(5):e2022JE007258. doi:10.1029/2022JE007258.] reported new water content maps in the upper meter of the regolith from epithermal neutron telescope on the ExoMars Trace Gas Orbiter. In order to standardize their data, they selected a baseline as a very dry region of Mars (the Solis Planum region between 115° W and 65° W longitude and 55° W and 15° W latitude) that had previously been estimated to average about 2.78% WEH and set the count rate there as equivalent to 2.78% WEH. This differs from the assumption used for Mars Odyssey, but it only slightly changes the scale.
The spatial resolution of the Mars Odyssey instrument was about 550 km. The FREND DSEN claims to achieve resolution of 200 km, but in a few extraordinary cases, it is claimed to drop to as low as 60 km, depending on the amplitude of neutron flux variability and available statistics, as well as any a priori information on the contour of the measured area (where the contours of WEH can be aligned with the higher resolution of the land contours). It is claimed that the 200 km resolution can be achieved anywhere on Mars, and the 60 km resolution can only be achieved in some local areas where there is high variability along with independent data on the shape/size of the measured area. This is an important improvement compared to previous neutron detectors in the Martian orbit, that were all omnidirectional and measured neutron flux from horizon to horizon.
The authors emphasized that “FREND, and all other orbital neutron spectrometers, are statistical instruments, meaning that measurements of any surface feature should be performed with sufficiently long exposure times before an acceptable number of counts is accumulated for a high enough statistical significance. Thus, it is evident, that as FREND was operating and accumulating data in each surface element (or pixel) over Mars, more and more features become detectable.” In an affiliated paper, they focused in on one area – Valles Marineris [2727Mitrofanov A, Malakhov A, Djachkova M, et al. The evidence for unusually high hydrogen abundances in the central part of Valles Marineris on Mars. Icarus. 2022;374. doi:10.1016/j.icarus.2021.114805.]. We discuss this later in this section. In Malakhov, et al. [2727Mitrofanov A, Malakhov A, Djachkova M, et al. The evidence for unusually high hydrogen abundances in the central part of Valles Marineris on Mars. Icarus. 2022;374. doi:10.1016/j.icarus.2021.114805.], they providing the first global survey – a high spatial resolution equatorial map of water distribution in the upper meter of the Martian regolith, observed between May 2018 and November 2021 (total 1287 Martian sols, close to 2 Martian years).
Here we review some findings by Malakahov, et al. [2626Malakhov AV, Mitrofanov IG, Golovin DV, et al. High resolution map of water in the Martian regolith observed by FREND neutron telescope onboard ExoMars TGO. Journal of Geophysical Research: Planets. 2022;127(5):e2022JE007258. doi:10.1029/2022JE007258.].
Figure 7 provides a comparison of the higher resolution map (200 km) to the omnidirectional map (550 km). Unlike the study by Wilson, et al. [2424Wilson JT, Eke VR, Massey RJ, et al. Equatorial locations of water on Mars: improved resolution maps based on Mars Odyssey Neutron Spectrometer data. Icarus. 2018;295:148. doi:10.1016/j.icarus.2017.07.028.] where the higher and lower resolution images did not correlate well, the FREND/DSEN hi-res and low-res maps correlate very well, and one can easily visualize how one leads to the other as the resolution is increased. It is notable that throughout the entire realm of longitude, and the latitude range ± 50°, the highest value of WEH in the higher resolution plot is 8%. However, notice that the highest WEH in the lower resolution plot is 6%. This shows that smaller local areas with higher WEH become diluted at lower resolution because they are averaged with areas of low WEH. Therefore, we can expect that as the resolution is further reduced from 200 km, the maximum of 8% will increase in some small areas.
Figure 7: Water equivalent hydrogen maps, measured by collimated FREND/DSEN. (a) Upper map is collimated for maximum resolution (200 km). (b) Lower map is omni directional (550 km). Black and white isolines correspond to WEH values. Adapted from Figure 2 of Malakahov, et al. [2626Malakhov AV, Mitrofanov IG, Golovin DV, et al. High resolution map of water in the Martian regolith observed by FREND neutron telescope onboard ExoMars TGO. Journal of Geophysical Research: Planets. 2022;127(5):e2022JE007258. doi:10.1029/2022JE007258.].
Malakahov, et al. [2626Malakhov AV, Mitrofanov IG, Golovin DV, et al. High resolution map of water in the Martian regolith observed by FREND neutron telescope onboard ExoMars TGO. Journal of Geophysical Research: Planets. 2022;127(5):e2022JE007258. doi:10.1029/2022JE007258.] selected three areas in Figure 7 to try to achieve even greater increased resolution, and the WEH contours for these three areas are shown in Figure 8. Figure 9 shows a comparison of how the improved resolution changed the map for the upper left plot of Arabia Terra in Figure 8.
Figure 8: Enhanced segments of the global map shown in Figure 7, showing details of three areas with most water content: Arabia Terra (top left), Medusa Fossae (top right) and Arcadia Planitia (bottom). Adapted from Figure 3 of Malakahov, et al. [2626Malakhov AV, Mitrofanov IG, Golovin DV, et al. High resolution map of water in the Martian regolith observed by FREND neutron telescope onboard ExoMars TGO. Journal of Geophysical Research: Planets. 2022;127(5):e2022JE007258. doi:10.1029/2022JE007258.].
Figure 9: Comparison of the Arabia Terra segment of the WEH map at highest resolution to map at 200 km resolution. The small areas with WEH = 10% increase in size. Adapted from Figures 2 and 3 of Malakahov, et al. [2626Malakhov AV, Mitrofanov IG, Golovin DV, et al. High resolution map of water in the Martian regolith observed by FREND neutron telescope onboard ExoMars TGO. Journal of Geophysical Research: Planets. 2022;127(5):e2022JE007258. doi:10.1029/2022JE007258.].
The highest WEH was found in Arcadia Planita near 47° N latitude and 142° W longitude: an elliptical area of about 5 km x 10 km with apparent WEH = 21%. This was surrounded by a larger region that averaged WEH = 16%. The next greatest values of WEH elsewhere in the ±50° latitude range was typically in the 8% to 12% range.
An impression of the uncertainties in the WEH estimates is provided in Figure 10. If the uncertainty at any location is σ, the upper plot shows the most probable value –σ and the lower plot shows the most probable value +σ. If we focus on the blue area between longitude 0° and 30°, the maximum value in the upper plot is WEH = 9% and the maximum value in the lower plot is WEH = 13%, suggesting an uncertainty of about ±2%.
Malakahov, et al. [2626Malakhov AV, Mitrofanov IG, Golovin DV, et al. High resolution map of water in the Martian regolith observed by FREND neutron telescope onboard ExoMars TGO. Journal of Geophysical Research: Planets. 2022;127(5):e2022JE007258. doi:10.1029/2022JE007258.] noted several local areas with greater than average WEH. Two areas with the highest apparent WEH were: WEH = 23% at -17° N latitude, and WEH = 24% at 8° N latitude. The authors suggested that random errors accumulated, and the actual values might be about 16%. In both cases, the outline of high WEH follows the altitude contours quite closely. They also discussed other interesting sites where the outline of WEH follows the local terrain. In their discussion they pointed out the enigma that on the one hand, one does not expect relict ice to remain in the upper meter at low latitudes, but on the other hand, this would require a very large endowment of hydrated minerals that is not confirmed by IR observations. They also noted that this area occurs at low elevation compared to surrounding areas.
Figure 10: Minimum (a) and maximum (b) Water Equivalent Hydrogen (WEH) maps accompany the mean WEH map on Figure 8 and show the range of possible values, considering the measurements uncertainties with +σ and -σ. Adapted from Figure 5 of Malakahov, et al. [2626Malakhov AV, Mitrofanov IG, Golovin DV, et al. High resolution map of water in the Martian regolith observed by FREND neutron telescope onboard ExoMars TGO. Journal of Geophysical Research: Planets. 2022;127(5):e2022JE007258. doi:10.1029/2022JE007258.].
Mitrofanov, et al. [2727Mitrofanov A, Malakhov A, Djachkova M, et al. The evidence for unusually high hydrogen abundances in the central part of Valles Marineris on Mars. Icarus. 2022;374. doi:10.1016/j.icarus.2021.114805.] focused on a small area (about 400 km x 250 km) in the Valles Marineris at around longitude 72°W and latitude 7°S. Pushing their resolution to the highest possible value, they found an average WEH of 40.3% in this area (Figure 11).
Figure 11: The small (purple) region with observed 40.3% WEH. Adapted from Figure 1 of Mitrofanov, et al. [2727Mitrofanov A, Malakhov A, Djachkova M, et al. The evidence for unusually high hydrogen abundances in the central part of Valles Marineris on Mars. Icarus. 2022;374. doi:10.1016/j.icarus.2021.114805.].
We then wondered how this compared to the upper plot in Figure 7. We overlaid Figure 11 on Figure 7, and the result is Figure 12. The red rectangle in Figure 12 is the boundary of Figure 11. The yellow roughly elliptical curve represents the purple area from Figure 11. The red square is the size of a 200 km pixel for Figure 7 Something seems amiss. Considering the size of a 200 km pixel in Figure 7 as shown by the red square, the data in Figure 7 might have had enough resolution to pick up the putative region of 40.3% WEH claimed by Mitrofanov, et al. [2727Mitrofanov A, Malakhov A, Djachkova M, et al. The evidence for unusually high hydrogen abundances in the central part of Valles Marineris on Mars. Icarus. 2022;374. doi:10.1016/j.icarus.2021.114805.]. The plot in Figure 7 shows about 6%. The very hi-res plot does not seem compatible with the 200-km resolution plot.
Figure 12: Water equivalent hydrogen map, measured by collimated FREND/DSEN – collimated for maximum resolution (200 km). The small area studied by Mitrofanov, et al. [2727Mitrofanov A, Malakhov A, Djachkova M, et al. The evidence for unusually high hydrogen abundances in the central part of Valles Marineris on Mars. Icarus. 2022;374. doi:10.1016/j.icarus.2021.114805.] is superimposed as a yellow elliptical curve. Adapted from Figure 2 of Malakahov, et al. [2626Malakhov AV, Mitrofanov IG, Golovin DV, et al. High resolution map of water in the Martian regolith observed by FREND neutron telescope onboard ExoMars TGO. Journal of Geophysical Research: Planets. 2022;127(5):e2022JE007258. doi:10.1029/2022JE007258.] and Figure 1 of Mitrofanov, et al. [2727Mitrofanov A, Malakhov A, Djachkova M, et al. The evidence for unusually high hydrogen abundances in the central part of Valles Marineris on Mars. Icarus. 2022;374. doi:10.1016/j.icarus.2021.114805.].
Several studies using spectroscopy from Mars orbit identified places on Mars with high concentrations of hydrated minerals. Interestingly, these tend to cluster near the region with high hydrogen content, but not in it. As Mitrofanov, et al. [2727Mitrofanov A, Malakhov A, Djachkova M, et al. The evidence for unusually high hydrogen abundances in the central part of Valles Marineris on Mars. Icarus. 2022;374. doi:10.1016/j.icarus.2021.114805.] pointed out, heavily hydrated magnesium sulphate can contain more than 50% H2O by weight. To explain the observed 40.3% WEH in terms of sulfate hydrates, one would have to postulate a very high concentration of the hydrate – which the authors thought was unlikely. The mean elevation of the WEH rich area is –1,455 m (relative to the MOLA Datum) and is a minimum near the center of the region. In the end, they concluded that they could not distinguish between hydrated minerals and ice embedded in the top 1 meter of regolith.
4.4 Comparison to physical properties of mars
Figure 10 shows that relatively higher hydrogen concentrations occur in three (blue) longitudinal regions in the latitude range ±50°. These tend to run the full gamut of latitude but are each limited to a 60° range of longitude.
Jakosky, et al. [2828Jakosky BM, Mellon MT, Varnes ES, Feldman WC, Boynton WV, Haberle RM. Mars low-latitude neutron distribution: possible remnant near-surface water ice and a mechanism for its recent emplacement. Icarus. 2005;175:58-67. Erratum in: Icarus. 2005;178:291-293.] explored the quantitative connections between the regolith water abundance and each of the physical properties that might be controlling the abundance. They estimated the degree of correlation between each of the physical parameters: (a) abundance of water as measured by neutron spectrometer, (b) annual peak abundance of water vapor, (c) mean annual surface temperature, (d) topography, (e) mean annual water vapor corrected for topography, (f) thermal inertia, (g) mean annual water vapor uncorrected for topography, and (h) albedo. Data were compared between latitudes of ±45° latitude only. They found a notable lack of statistical correlation between water abundance and any of the parameters, either singly, or in groups. They concluded: "no single parameter is able by itself to explain a significant fraction of the water distribution."
However, Putzig, et al. [2929Putzig NE, Mellon MT, Kretke KA, Arvidson RE. Global thermal inertia and surface properties of Mars from the MGS mapping mission. Icarus. 2005 Feb;173(2):325-341. doi:10.1016/j.icarus.2004.08.017.] provides a plot of thermal inertia that some what resembles Figure 10 in that the thermal inertia tends to be lower in the regions of higher hydrogen abundance. Regions with low thermal inertia are cooler and might be more conducive to ice longevity.
Discussion
Mars is believed to have had liquid water in the very distant past. Water on Mars today occurs either as vapor, bounded water in regolith, ice and hydrated minerals.
Prior to the last ~ 300,000 years, water was periodically transported between the poles and the temperate regions of Mars as the obliquity varied, and at times, near-surface water ice was stable in temperate regions. Most of the near surface of Mars regolith was endowed with great amounts of ice during this period. As the obliquity retreated and stabilized somewhat in the last 300,000 years, near-surface ground ice became theoretically unstable to sublimation in temperate zones, and although much of that ground ice disappeared over the many years, significant ground ice remained at some locations.
Acquisition of a source of indigenous water on Mars would provide vital support for various conceptual human missions [33Rapp D. Will SpaceX send humans to Mars in 2028? IgMin Res. 2024 Dec 13;2(12):969-983. IgMin ID: igmin274. doi: 10.61927/igmin274. Available from: igmin.link/p274-55Rapp D. Human Missions to Mars. 2nd ed. 2012; 3rd ed. 2023. Heidelberg (Germany): Springer-Praxis Books; Springer. Appendix A: Solar energy on Mars. Appendix C: Water on Mars.]. We need not elaborate on that point. Searching for water on Mars is a challenging endeavor, and it is useful in the beginning to make synoptic analyses and observations to characterize the overall distribution.
Several scientists analyzed the process by which ice is lost from regolith to the atmosphere, which at any locality depends mainly on the vapor pressure of water, the thermal inertia of the soil, and the orientation and slope of the surface. For average conditions, near-surface ice is not expected to be thermodynamically stable at latitudes less than perhaps 55° to 60°. Yet, it is known from observation of ice ejected from some craters by impacts, that some near-surface remnant ice remains at various moderate locations on Mars (See Section 5.). This provided incentive to analyze heavily sloped (slope up to 30°) [1111Mellon MT, Phillips RJ. Recent gullies on Mars and the source of liquid water. Abstracts of Papers Submitted to the 32nd Lunar and Planetary Science Conference. Houston (TX): Lunar and Planetary Institute; 2001. CD 32, Abstract 1182.,14-1614-16Vincendon M, Mustard J, Forget F, et al. Near-tropical subsurface ice on Mars. Geophysical Research Letters. 2010. doi:10.1029/2009GL041426.], North-facing slopes and indeed they concluded that ice might be stable to much lower latitudes at such extreme slopes. This seems to be a bit of sidetrack because 30° slopes are rare, they are not attractive for landing sites, and the calculations are approximate. The real point is that even though equilibrium thermodynamics indicates ice is unstable at some locations, the rate of loss might be exceedingly slow. The models basically tell us that if we find ice in temperate zones, it is probably due to slow kinetics. They also suggest that it is highly unlikely to find near-surface ice in the equatorial zone (± 30° latitude).
Models are useful, but observations are better. In a breakthrough, the Mars Odyssey Team used neutron spectroscopy from orbit to map essentially the top ~1 m of the whole planetary surface of Mars. Their observations detected hydrogen, which could be due to hydrated minerals or ground ice. The results were roughly in line with the analyses. Heavy concentrations of hydrogen were found poleward of +60° and -60° latitude, and in a few local regions, as low as ~ 45°. In addition, lower (but non-negligible) concentrations of hydrogen were found in various area in the equatorial zone (± 30° latitude). The limitation of these observations was the low resolution with a pixel of about 550 km in dimension. A region 550 km x 550 km with low average hydrogen might be broadly low in hydrogen or might contain a few small areas with very high hydrogen content. In general, one suspects that the hydrogen at the lowest latitudes is probably mineral hydrates; yet without ground truth verification, one can only guess. Subsequently, an excellent Russian Team carried out further studies using neutron spectroscopy from orbit in a Russian-European mission, that significantly improved the resolution of the observations (broadly 200 km x 200 km, and in a few specific places claimed to be approaching 60 km x 60 km). They concentrated their observations on temperate and equatorial sites. Almost all their measurements in the equatorial region are compatible with mineral hydrates and probably likely to be so. In a couple of small equatorial sites, the apparent hydrogen concentration was so high as to challenge the possibility of mineral hydrates. However, when one compares the very highest resolution maps to lower resolution maps, they don’t seem to be compatible, and it is not clear to us how valid the highest resolution (60 km) maps might be.
The neutron spectra measurements are important but suffer from two limitations: (1) they don’t detect hydrogen much deeper than ~ 1 m, and (2) the low resolution hides local areas of high hydrogen concentration.
Zheng, et al. [3030Zheng L. Water ice resources on the shallow subsurface of Mars: indications to rover-mounted radar observation. Remote Sensing (MDPI). 2024;16(5):824. Available from: https://www.mdpi.com/2072-4292/16/5/824.] briefly summarized the working principles of Martian ground-penetrating radar:
“The radar antenna emits radar pulses towards the subsurface of Mars. When the radar electromagnetic waves encounter differences in impedance from subsurface materials, reflections and scattering of the electromagnetic waves occur at the interfaces between different materials. These echo signals are then captured by the radar antenna. The data received by the radar are then analyzed to calculate the subsurface stratification and thickness of the soil on Mars, as well as the dielectric properties of the subsurface material, such as the value of dielectric loss and relative permittivity. By determining the polarization of the radar signal, it is potentially feasible to ascertain the presence of water ice in the superficial layers of the detection area. By processing these echo signals, the subsurface structure of the Mars surface and the composition of the subsurface materials can also be revealed” [3030Zheng L. Water ice resources on the shallow subsurface of Mars: indications to rover-mounted radar observation. Remote Sensing (MDPI). 2024;16(5):824. Available from: https://www.mdpi.com/2072-4292/16/5/824.].
Orbiter-based radars such as MARSIS, SHARAD, and MOSIR have a wide areal detection range. Penetration depths vary from about 0.1 km to 1 km. SHARAD has been orbiting Mars on the MRO since 2006.
The following is abstracted from Virkki, et al. [3131Virkki AK, Neish CD, Rivera-Valentín EG, et al. Planetary radar—state-of-the-art review. Remote Sensing (MDPI). 2023;15(23):5605. Available from: https://www.mdpi.com/2072-4292/15/23/5605.]:
Electromagnetic waves are capable of penetrating into most natural materials up to hundreds of wavelengths, depending on the nature of the material, before being absorbed. Radar can penetrate into dry regolith and ice up to kilometers depth in some cases. If a dielectric discontinuity is present within the material, part of the wave is backscattered, and can be detected by a receiving antenna. This property has been used in radio echo sounding, or ice-penetrating radar, an established geophysical technique that has been used for more than five decades to investigate the structure of ice sheets and glaciers in Antarctica, Greenland, and the Arctic. Subsurface dielectric discontinuities in the form of layered sedimentary deposits or volumetric inclusions are imaged at resolutions of tens of meters. The Mars Advanced Radar for Subsurface and Ionosphere Sounding (MARSIS) and the SHAllow RADar (SHARAD) were the first to utilize this technique to explore the subsurface of Mars, and more recently by the Mars Orbiter Subsurface Investigation Radar (MOSIR). In addition, water ice within a layer is detected by its unique dielectric constant that distinguishes it from dry regolith.
5.2 The Medusae Fossae Formation (MFF)
The Medusae Fossae Formation (MFF) is located on Mars at 130–230°E and 12°S–12°N, straddling the equator. Shallow Radar (SHARAD) aboard the Mars Reconnaissance Orbiter (MRO), identified distinct layers well below the surface in the MFF. Watters, et al. [3232Watters TR, Campbell BA, Leuschen CJ, et al. Evidence of ice-rich layered deposits in the Medusae Fossae Formation of Mars. Geophysical Research Letters. 2023. doi:10.1029/2023GL105490.] argued that it is difficult to explain the observations based on compositions of volcanic ash, eolian sediments, or dust. Compaction models of such fine-grained materials are in disagreement with observed dielectric and density measurements. Instead, Watters, et al. [3232Watters TR, Campbell BA, Leuschen CJ, et al. Evidence of ice-rich layered deposits in the Medusae Fossae Formation of Mars. Geophysical Research Letters. 2023. doi:10.1029/2023GL105490.] argued for a multi-layer ice-poor upper layer some 300 m to 600 m thick, overlaying an ice-rich layer at least 1 km thick, representing a potential volume of water-ice equivalent to be 1.5– 2.7 m global equivalent layer (GEL). Fastook, et al. [3333Fastook JL, Head JW. Origin of ice in the Medusae Fossae Formation, equatorial Mars. Icarus. 2024;421:116226. doi:10.1016/j.icarus.2024.116226.] justified the interpretation of radar signals as buried ice, reasoning that several billion years ago, the Mars obliquity could have reached ~40° for a few million years and during this period, the MFF region might have accumulated snow/ice in excess of a km. Subsequent ablation of this ice deposit surface in the several billion year-long period that followed, episodic eolian stripping of MFF protective sublimation residues and dust/tephra deposits, provides a mechanism sufficient to form the thick capping layer. If indeed this proves to be a buried ice deposit, that is very impressive – but unlikely to be useful for practical application. While it is not totally beyond conceivability, it seems very unlikely that this resource would be of any practical use in the near term or even mid-term. Nevertheless, this discovery was provided as a press release under the title “Buried water ice at Mars's equator?” with 47,000 views and 95 “likes” [3434European Space Agency (ESA). Buried ice at the equator. 2024. Press release. Available from: https://www.esa.int/Science_Exploration/Space_Science/Mars_Express/Buried_water_ice_at_Mars_s_equator.].
5.3 The subsurface of the arcadia planita and utopia planitia regions
Putzig, et al. [3535Putzig N, Brothers TC, Sutton S. Widespread excess ice in Arcadia Planitia, Mars. Geophysical Research Letters. 2015. doi:10.1002/2015GL064844.] and Bramson, et al. [3636Bramson AM, Byrne S, Putzig NE, et al. Widespread excess ice in Arcadia Planitia, Mars. Geophysical Research Letters. 2015 Aug 26. doi:10.1002/2015GL064844.] oddly seem to be similar papers published on the same study with the same results – but with two slightly different sets of authors. This study used radar to determine the apparent dielectric constant of the sub-surfaces of a large number of so-called terraced craters in the Arcadia Planitia (at latitude range 38–52°N and longitude range 165°–210° East) across 1 million km2. By a rather intricate process that was not completely understandable to us, they concluded that the measurements typically represented strong ice signals for tens of meters from the surface downward in hundreds of terraced craters. From that, they suggested a veritable ocean of ice embedded in regolith across 1 million km2 in the Arcadia Planitia at 38 – 52°N. They did not clarify specific observations at the lowest latitudes.
Bramson, et al. [3737Bramson AM, Byrne S, Bapst J. Preservation of midlatitude ice sheets on Mars. Journal of Geophysical Research: Planets. 2017;122:2250-2266. doi:10.1002/2017JE005357.] reported on radar reflectors as evidence of ice sheets at the Utopia Planita and the Arcadia Planita in the latitude range ~40°N to ~ 50°N. The reflectors were mostly ~100 m deep at the Utopia Planita but they were mainly around 50 m deep at the Arcadia Planita. They modeled the subsurface as a top desiccated layer, below which was a regolith layers with pores filled with ice (about 25% to 35% porosity), and below that was an “excess ice sheet”. The estimated thickness of the excess ice layer was 30 m to 80 m at Arcadia Planitia and 80 m to 170 m at the Utopia Planitia deposit. It was not clear how deep these excess ice layers are, but if the radar reflectors occur at the interface of the pore-filled and excess ice layers (only a guess because the article was unclear) then the excess ice layers would seem to be buried 50 m to 100 m.
These papers, like so many papers on discovery of ice on Mars, seems heavily endowed in optimism, which might be justified, but they ought to be approached with a bit more caution. They also ought to be much clearer on the estimated depth of various layers.
Gou, et al. [3838Gou S, Yue Z, Di K, et al. Subsurface stratigraphy suggested by the layered ejecta craters in the Martian northern planitiae. Icarus. 2024;416:116100. doi:10.1016/j.icarus.2024.116100.] carried out an extensive review of data on layered ejecta craters (LECs) at the planitas: Acidalia, Chryse, Utopia, Isidis, Amazonis, and Arcadia. These regions are illustrated in Figure 13. The data is summarized in Table 1. While there is a great deal of water tied up as ice, most of it is too deep to be practical in the near-term to mid-term.
Figure 13: Water equivalent hydrogen map, measured by collimated FREND/DSEN – collimated for maximum resolution (200 km). The small area studied by Mitrofanov, et al. [2727Mitrofanov A, Malakhov A, Djachkova M, et al. The evidence for unusually high hydrogen abundances in the central part of Valles Marineris on Mars. Icarus. 2022;374. doi:10.1016/j.icarus.2021.114805.] is superimposed as a yellow elliptical curve. Adapted from Figure 2 of Malakahov, et al. [2626Malakhov AV, Mitrofanov IG, Golovin DV, et al. High resolution map of water in the Martian regolith observed by FREND neutron telescope onboard ExoMars TGO. Journal of Geophysical Research: Planets. 2022;127(5):e2022JE007258. doi:10.1029/2022JE007258.] and Figure 1 of Mitrofanov, et al. [2727Mitrofanov A, Malakhov A, Djachkova M, et al. The evidence for unusually high hydrogen abundances in the central part of Valles Marineris on Mars. Icarus. 2022;374. doi:10.1016/j.icarus.2021.114805.].
They also pointed out that others had found related results. For instance, one early study inferred the depth to the top of an ice-rich layer where LECs are initially observed (“roof depth”) to be about 300–400 m at 30° latitude and decreases to about 50–100 m at 50°. Another found the roof depth varies regionally within ±30° latitude range and could be as shallow as 110 m in Solis and Thaumasia Planae. Yet another estimated the subsurface ice table in the equatorial region of the Valles Marineris plateaus to be between ~75 m and ~ 260 m.
Stuurman, et al. [3939Stuurman CM, Osinski GR, Holt JW, et al. SHARAD detection and characterization of subsurface water ice deposits in Utopia Planitia, Mars. Geophysical Research Letters. 2016;43(18):9484-9491. doi:10.1002/2016GL070138.] used radar to investigate the Utopia Planitia (spanning approximately 375,000 km2 (35–50°N; 80–115°E). They found widespread areas with a radar reflector perhaps 50 to 120 m below the surface and they were able to estimate the dielectric constant for the subsurface above the reflector. The described these upper layers as “layered mesas”, which term despite their best efforts, still leaves us confused. They claimed the evidence showed that the layered mesas were heavily laden with ice. In their conclusions, they said:
“The presence of a water ice deposit 80–170 m thick and approximately 375,000 km2 in area in western Utopia Planitia is supported by radar evidence... The material overlying the reflective interface found in this work is estimated to be 50% - 85% water ice by volume. We estimate a water ice volume of approximately 8,400–14,300 km3 within the layered mesas” [3939Stuurman CM, Osinski GR, Holt JW, et al. SHARAD detection and characterization of subsurface water ice deposits in Utopia Planitia, Mars. Geophysical Research Letters. 2016;43(18):9484-9491. doi:10.1002/2016GL070138.].
One very important aspect they did not report was the latitudinal distribution of the icy area. The word “latitude” occurs 15 times in the paper, but there doesn’t seem to be any information on the latitudinal extent of the observations, especially the region below 40°N. Another factor they did not discuss at all was the depth of any overburden before the ice begins. These two factors are the most important for any ice distribution and somehow the authors did not report on them.
Hibbard, et al. [4040Hibbard SM, Williams NR, Golombek MP, Osinski GR, Godin E. Evidence for widespread glaciation in Arcadia Planitia, Mars. Icarus. 2021;359:114298. doi:10.1016/j.icarus.2020.114298.] combined several lines of investigation (expansive radar reflective region with high densities of scalloped depressions and polygonal terrain) to justify the RADAR findings spanning approximately 375,000 km2 in (SHARAD) data over western Utopia Planitia.
None of the above papers clarified the range of lower latitudinal data or the depth of overburden, which is the most important information involved. Indeed, this vital data is often missing from reports of ice on Mars.
Wang, et al. [4141Wang Y, Feng X, Zhou H, et al. Water ice detection research in Utopia Planitia based on simulation of Mars rover full-polarimetric subsurface penetrating radar. Remote Sensing (MDPI). 2022. Special issue: Advanced Ground Penetrating Radar Theory and Applications.] imagined a subsurface structure for the Utopia Planita involving 1 m of dry Colian sediment, atop about 0.7 m of ice-bearing Colian sediment, atop about 0.5 m of ice-bearing Basalt sediment. We were unable to connect this model any real data.
Ma, et al. [4242Ma Y, Xiao Z, Luo F, et al. SHARAD observations for layered ejecta deposits formed by late-Amazonian-aged impact craters at low latitudes of Mars. Icarus. 2023;404:115689. doi:10.1016/j.icarus.2023.115689.] investigated possible existence of subsurface water ice at low latitudes of Mars. SHARAD radargrams for late-Amazonian-aged impact craters were studied. They systematically investigated subsurface structures of layered ejecta deposits (LED) that were formed by 27 late-Amazonian-aged impact craters at low latitudes of Mars. The selected craters have pristine preservation states, and their LED were wide and thick enough to be resolved by SHARAD. Their results show that nearly all the investigated craters exhibit no discernible subsurface reflectors, suggesting little difference in dielectric properties between LEDs and surrounding terrain.
5.4 Lobate debris aprons
Lobate debris aprons (LDA) are dust and rock-covered Martian landforms thought to contain buried water ice due to their resemblance to creeping permafrost and debris-covered glaciers on Earth.
Plaut, et al. [4343Plaut JJ, Safaeinili A, Holt JW, Phillips RJ, Head JW, Seu R, Putzig NE, Frigeri A. Radar evidence for ice in lobate debris aprons in the mid-northern latitudes of Mars. Geophys Res Lett. 2009;36:L02203. doi:10.1029/2008GL036379.] described Martian surface features identified as lobate debris aprons (LDAs) as thick (100s of m) masses of material that extend up to several 10s of km from high relief slopes and terminate in lobate (curved) fronts. They presented new evidence from the Shallow Radar (SHARAD) sounding experiment on Mars Reconnaissance Orbiter (MRO) that LDAs in the Deuteronilus Mensae region (centered at 41°N, 26°E) consist mostly of ice. They described the area as “mid-northern latitudes” but did not specify the exact range.
Peterson, et al. [4444Petersen EI, Holt JW, Levy JS. High ice purity of Martian lobate debris aprons at the regional scale: evidence from an orbital radar sounding survey in Deuteronilus and Protonilus Mensae. Geophys Res Lett. 2018;45(21):11595-11604. doi:10.1029/2018GL079759.] present a comprehensive orbital radar sounding survey of lobate debris aprons in Deuteronilus and Protonilus Mensae (DPM) located in the Martian dichotomy between the southern highlands and the northern lowlands. They concluded that the dielectric properties of penetrated aprons are consistent with a high purity (>80%) water ice composition; these aprons are concluded to be debris-covered glaciers. The indication is that a huge amount of water might be tied up in these LDAs. But it is not at all clear what the range of latitudes is.
Chuang, et al. [4545Chuang FC, Crown DA, Berman DC, Joseph ECS. Mapping lobate debris aprons and related ice-rich flow features in the Southern Hemisphere of Mars. 44th Lunar and Planetary Science Conference. 2013.] mapped LDAs in the southern hemisphere between 30°S and 60°S latitude between 83°E and 180°E longitude. A total of 803 LDA complexes, including 1,278 individual LDAs, were mapped and attributed thus far. Early results indicate that the majority of LDAs are associated with impact craters and massifs (88.2%). The combined areal coverage of these two feature types also forms the majority (73.3%) for all LDAs.
Sinha and Ray [4646Sinha RK, Ray D. Extensive glaciation in the Erebus Montes region of Mars. Icarus. 2021;367:114557. doi:10.1016/j.icarus.2021.114557.] examined 236 individual mesa-LDA systems, 84 groups of mesa-LDA systems, and 7 craters infilled with ice-related flow units within the Erebus Montes region in the northern mid-latitudes of Mars (41.5° N, 164° W – 33.5° N, 177.7° W).
Baker and Head [4747Baker DMH, Head JW. Extensive Middle Amazonian mantling of debris aprons and plains in Deuteronilus Mensae, Mars: implications for the record of mid-latitude glaciation. Icarus. 2015;260:269-288. Available from: https://citeseerx.ist.psu.edu/document?repid=rep1&type=pdf&doi=14f39b8bcd6c88f7460dcf9bf9d04ea2b2cac803] focused their study of LDAs on the “mid-latitudes of Mars”. Their Figure 1 shows the actual study covered 42°N to 48°N at longitudes 20°E to 36°E. One of the rare papers that specified the range.
Like so many articles on Mars ice, hardly any information was given by Plaut, et al. or Peterson, et al. on the latitudinal distribution or the amount of overburden. Published papers on LDAs are impressive by the sheer volume of ice, but how is it distributed? Too many authors use the phrase “mid-latitudes of Mars” – but what does that mean, and how many LDAs are observed at the lowest latitudes in the range? Too many articles are unclear about the important range at lowest latitudes.
One oddity is Hauber, et al. [4848Hauber E, van Gasselt S, Chapman MG, Neukum G. Geomorphic evidence for former lobate debris aprons at low latitudes on Mars: indicators of the Martian paleoclimate. JGR Planets. 2008 Feb 21. doi:10.1029/2007JE002897.] who reviewed geomorphic evidence from photos that suggested LDA areas had ice below the surface. They claimed that “these depressions or moats are located equatorward of ±30°”. Yet, their Figure 6 suggests most of the LDA area is at 40°N or above and they reach down to 30° in only a few places. No LDAs are found within ±30° despite claims by the authors.
A very recent publication by Steinberg, et al. [4949Steinberg Y, Smith IB, Aharonson O. Physical properties of subsurface water ice deposits in Mars’s mid-latitudes from the Shallow Radar. Icarus. 2025;441:116716.] revisited some previously studied LDA sites and added additional LDA sites. Their work increases global coverage across the northern and southern hemispheres, examining five sites with enhanced data coverage and incorporating both dielectric constant (????′) and loss tangent (tan ????) to improve the analysis. They showed the consistency of implied ice at least 80% pure from site to site implies formation by a common mechanism. The locations of the five sites are shown in Figure 14. The latitude ranges of the various regions were:
Tempe Terra 48°N
Phlegra Montes 35°N
Eastern Hellas 45°S
Nereidum Montes 48°S
Deuteronilus Mensae 48° to 35°N
Figure 14: Regions explored by Steinberg, et al. [4949Steinberg Y, Smith IB, Aharonson O. Physical properties of subsurface water ice deposits in Mars’s mid-latitudes from the Shallow Radar. Icarus. 2025;441:116716.]. The rectangles define regions where LDA occur, the stars are where observations were made and analyzed, and the lines at DM represent traces. Adapted from Figure 1 of Steinberg, et al. [4949Steinberg Y, Smith IB, Aharonson O. Physical properties of subsurface water ice deposits in Mars’s mid-latitudes from the Shallow Radar. Icarus. 2025;441:116716.].
It would have been of great interest to learn about the distribution of LDAs near 35°N and whether prospects exist at lower latitudes but almost no emphasis was placed on latitude.
In several places they referred to “debris layers” covering the ice, but claimed that estimation of the thickness of this layer was not possible from the observations. Clearly, none of this putative ice is within 1 m of the surface since it was not picked up by the neutron spectrometers.
5.5 In situ ground-based RADAR
Hamran, et al. [5050Hamran S-E, Paige DA, Amundsen HEF. Radar Imager for Mars’ Subsurface Experiment (RIMFAX). Space Sci Rev. 2020;216:128. doi:10.1007/s11214-020-00740-4.] described the Radar Imager for Mars’ Subsurface Experiment (RIMFAX) that is included in the payload of NASA’s Mars 2020 Perseverance Rover. RIMFAX provides the capability to image the shallow subsurface beneath the rover. Hamran, et al. [5151Hamran SE, Paige DA, Allwood A, Amundsen HEF, Berger T, Brovoll S, Carter L, Casademont TM, Damsgård L, Dypvik H, Eide S, Fairén AG, Ghent R, Kohler J, Mellon MT, Nunes DC, Plettemeier D, Russell P, Siegler M, Øyan MJ. Ground penetrating radar observations of subsurface structures in the floor of Jezero crater, Mars. Sci Adv. 2022 Aug 26;8(34):eabp8564. doi: 10.1126/sciadv.abp8564. Epub 2022 Aug 25. PMID: 36007008; PMCID: PMC9410267.] reported on the initial measurements of RIMFAX but did not find evidence of water ice at the Jezero Crater (18.3° N, 77.6° E). Paige, et al. [5252Paige D, Hamran S-E, Amundsen HEF, Berger T. Ground penetrating radar observations of the contact between the western delta and the crater floor of Jezero Crater, Mars. Science Advances. 2024 Jan 26;10(4). doi:10.1126/sciadv.adi8339.] reported on findings and again, no subsurface ice was detected. Zheng, et al. [3030Zheng L. Water ice resources on the shallow subsurface of Mars: indications to rover-mounted radar observation. Remote Sensing (MDPI). 2024;16(5):824. Available from: https://www.mdpi.com/2072-4292/16/5/824.] reported that the RIMFAX on the Perseverance rover did not find evidence of water ice at the Jezero Crater. Zheng, et al. went on to say: “Nevertheless, it is anticipated that the rover, traveling longer distances, is expected to find evidence of water ice on the shallow surface layers of Mars”. Several papers on RIMFAX don’t even mention ice as a possibility, including Paige and Hamran. Zheng seems to be overly optimistic to expect water ice to be found anywhere near 18.3°N.
Zhou, et al. [5353Zhou B, Shen S, Lu W, Liu Q, Tang C, Li S, Fang G. The Mars rover subsurface penetrating radar onboard China’s Mars 2020 mission. Earth Planet Phys. 2020;4:345-354.] described China's Mars probe, named Tianwen-1, that includes a is a Subsurface Penetrating Radar module (RoSPR) on a landed rover. This paper describes the design of the instrument and some results of field experiments. Later publications further discuss the instrument but it is not clear what was accomplished.
Li, et al. [5454Li C, Zheng Y, Wang X, Zhang J, Wang Y, Chen L, Zhang L, Zhao P, Liu Y, Lv W, Liu Y, Zhao X, Hao J, Sun W, Liu X, Jia B, Li J, Lan H, Fa W, Pan Y, Wu F. Layered subsurface in Utopia Basin of Mars revealed by Zhurong rover radar. Nature. 2022 Oct;610(7931):308-312. doi: 10.1038/s41586-022-05147-5. Epub 2022 Sep 26. Erratum in: Nature. 2023 Feb;614(7947):E30. doi: 10.1038/s41586-023-05734-0. PMID: 36163288; PMCID: PMC9556330.] reported on an in-situ ground-penetrating radar survey of the Martian subsurface in a southern marginal area of Utopia Planitia conducted by the Zhurong rover of the Tianwen-1 mission. A detailed subsurface image profile was constructed along the roughly 1,171 m traverse of the rover, showing an approximately 70-m-thick, multi-layered structure below a less than 10-m-thick dry regolith. The location was 25°N, 110°E, elevation −4,100 m (relative to MOLA Datum). No evidence of ice was found down to depths of 100 m. It is unfortunate that this rover landed at a 25° latitude and therefore did not provide some measure of “ground truth” to the higher latitude observations based on SHARAD.
5.6 Summary
Radar observations implied huge layers of ice buried well below the surface at Medusae Fossae Formation (MFF), located at 130–230°E and 12°S–12°N, straddling the equator. A dry layer, some 300 m to 600 m thick, overlays an ice-rich layer at least 1 km thick. This suggests that substantial ice layers at depth might occur at other locations on Mars, even some equatorial locations. These ice deposits are unlikely to be accessible in the near term, but might be accessible in the more distant future.
Radar observations concluded that the Arcadia Planita and Utopia Planitia Regions have significant amounts of near-surface ice. However, the latitude distribution was not properly discussed, and one study found no ice at “low latitudes”. It is not clear how far South these deposits persist. In particular, does any of it occur below 40°N latitude?
Radar observations of lobate debris aprons lead to the same story. Plenty of ice was implied, but the latitude dependence is murky. In particular it is not clear whether these ice deposits persist to latitudes less than 40°. The term “mid-latitudes” should be banned from the journals.
A few limited rover-based radar observations were made but these were not in locations where ice is expected to be found.
6. Observations from orbit of surface ice or near-surface ice
6.1 Observations of ice ejected from recent craters
When an external object collides with Mars, creating a crater and ejecting matter to the surroundings, if ice was originally embedded within pores of the regolith, it would likely be exposed, but it would probably disappear via sublimation within a few days after exposure to the atmosphere. By contrast, large seams of ice might be ejected as discernable blocks surrounding the crater, and these would probably last for weeks or possibly even months.
Several reports were made of ice visually observed in ejecta from craters. Typically, publications emphasize where ice was seen. But it is equally important to know where ice does not occur, to develop a synoptic view of the surface and the extent of occurrence of ice. Daubar, et al. [1717Daubar IJ, Dundas CM, McEwen AS, et al. New craters on Mars: an updated catalog. JGR. 2022. doi:10.1029/2021JE007145.] was the only reference we could find that documented all the recent craters, not merely the ones that showed ice. They presented a catalog of new impacts on Mars. These craters formed in the last few decades, constrained by repeat orbital imaging. Crater diameters ranged from 58 m down to <1 m. For each impact, they reported several important features, as well as whether they displayed exposure of ice. They cataloged 1,203 crater sites of which 48 sites (4%) showed ice. Another 2% possible might possibly have ice (Figure 15). It is obvious from Figure 15 that occurrence of ice is almost exclusively limited to craters at 40° latitude and above, with a very few in the high thirties. They discussed the morphology of crater sites in detail, but we are only interested in the occurrence of ice.
Figure 15: Locations of 1,203 craters, showing which were dry, which showed ice, and which might have ice. Plotted from data provided by Daubar [1717Daubar IJ, Dundas CM, McEwen AS, et al. New craters on Mars: an updated catalog. JGR. 2022. doi:10.1029/2021JE007145.].
The craters in Figure 15 include a wide range of diameters. As Dundas, et al. [3636Bramson AM, Byrne S, Putzig NE, et al. Widespread excess ice in Arcadia Planitia, Mars. Geophysical Research Letters. 2015 Aug 26. doi:10.1002/2015GL064844.] pointed out, the typical depth of a crater is about 8.4% of the diameter. For the many craters included in Figure 15 that are smaller than about 12 m in diameter, the crater only plumbs the top ~ 1 m of surface and therefore Figure 15 does not reveal the ice content at depth except for the relatively few large craters. The average crater diameter for all craters in the study was 7.3 m, for those without ice, 7.2 m, for those with possible ice, 6.8 m, and for those with ice displayed, 8.6 m. This shows a small bias toward larger craters with exposed ice.
It is important to know where ice occurs but it is also important to know where ice doesn’t occur. Figure 15 provides a more realistic view than the other papers reporting ice around craters.
Dundas, et al. [5555Dundas CM, Mellon MT, Conway SJ, et al. Widespread exposures of extensive clean shallow ice in the midlatitudes of Mars. Journal of Geophysical Research: Planets. 2021;126(3). doi:10.1029/2020JE006617.,5656Dundas CM, Mellon MT, Posiolova LV, et al. A large new crater exposes the limits of water ice on Mars. Geophysical Research Letters. 2023;50(2). doi:10.1029/2022GL100747.] observed bright material around a large (150 m) crater at 35.1°N, 189.8°E consistent with water ice, as shown in Figure 16. A near-infrared spectrum offered confirmation. It is almost certain that the ice was ejected from the crater during impact. Bright patches and blocks (up to 3 m diameter) with icy coloration occur on the proximal ejecta, indicating that the impact excavated ice that is at least ∼3 m thick in places. Most of the ice deposits are in the continuous ejecta between 75 and 140 m from the crater center. For this ejecta, the depth from which the ice was ejected was estimated to be less than 8 m. For more distant ejecta, the depth was estimated to be less than 5 m. The floor of the crater was some 22 m below the crater ridge.
Figure 16: Large crater at 35.1°N, 189.8°E consistent with water ice in the ejecta. Adapted from Figure 1 of Dundas, et al. [5656Dundas CM, Mellon MT, Posiolova LV, et al. A large new crater exposes the limits of water ice on Mars. Geophysical Research Letters. 2023;50(2). doi:10.1029/2022GL100747.].
The primary crater is surrounded by thousands of secondary craters. A few of these craters display bright ice as well. This ice surrounding secondary craters was estimated to be ejected from depths of 2-5 m. At 35.1°N, this was the lowest latitude at which ejected ice from a crater was seen.
The new crater is nearly due south of ice-exposing craters at 39.1°N (the previous lowest-latitude such crater) where flat floors suggested an ice-table depth of ∼0.9 m (). It is within 120 km of radar reflectors inferred to indicate decameters-thick massive ice [5757Posiolova LV, Lognonné P, Banerdt WB, Clinton J, Collins GS, Kawamura T, Ceylan S, Daubar IJ, Fernando B, Froment M, Giardini D, Malin MC, Miljković K, Stähler SC, Xu Z, Banks ME, Beucler É, Cantor BA, Charalambous C, Dahmen N, Davis P, Drilleau M, Dundas CM, Durán C, Euchner F, Garcia RF, Golombek M, Horleston A, Keegan C, Khan A, Kim D, Larmat C, Lorenz R, Margerin L, Menina S, Panning M, Pardo C, Perrin C, Pike WT, Plasman M, Rajšić A, Rolland L, Rougier E, Speth G, Spiga A, Stott A, Susko D, Teanby NA, Valeh A, Werynski A, Wójcicka N, Zenhäusern G. Largest recent impact craters on Mars: Orbital imaging and surface seismic co-investigation. Science. 2022 Oct 28;378(6618):412-417. doi: 10.1126/science.abq7704. Epub 2022 Oct 27. PMID: 36302013.], that extend from ∼38° to 52°N. The discovery of significant near-surface ice at 35° latitude is a major finding. Further exploration in this vicinity to lower latitudes would be very valuable.
Viola, et al. [5858Viola D, McEwen AS, Dundas CM, Byrne S. Expanded secondary craters in the Arcadia Planitia region, Mars: evidence for tens of Myr-old shallow subsurface ice. Icarus. 2015;248:190–204.] provided a wealth of data and geological analysis of the distribution of subsurface ice in Arcadia Planitia, located in the northern mid-latitudes, by mapping thermokarstically expanded secondary craters, providing additional evidence for extensive excess ice down to 40°N or possibly lower. They concluded that ice can be preserved in the shallow subsurface for long periods of time, at least in some parts of Arcadia Planitia, where expanded secondary craters are especially abundant. Although a very large amount of ice was lost in the past, they argued that much more ice (at least 6,000 km3) is likely preserved beneath the un-cratered regions of Arcadia Planitia, since significant loss of this excess ice would have caused extensive terrain dissection and the removal of the expanded secondary craters. And although this paper is very informative for the science of water on Mars, we did not find much information regarding ice at the lower bounds of latitude.
6.2 Other observations of surface ice
Dundas, et al. [5656Dundas CM, Mellon MT, Posiolova LV, et al. A large new crater exposes the limits of water ice on Mars. Geophysical Research Letters. 2023;50(2). doi:10.1029/2022GL100747.] reported observation of ice at scarps. A scarp is a cut or erosion (a slope or hillside) so that it becomes steep, perpendicular, or precipitous. These scarps on Mars expose layers that would normally be several meters deep. If ice is present at that depth, some ice might become visible at the edges of the scarp. Figure 4 of Dundas, et al. [5555Dundas CM, Mellon MT, Conway SJ, et al. Widespread exposures of extensive clean shallow ice in the midlatitudes of Mars. Journal of Geophysical Research: Planets. 2021;126(3). doi:10.1029/2020JE006617.] suggests that these formations occur mainly at latitudes from 50° to 60°. They also reported observations of scarp ice adjacent to craters. The lowest latitude where ice was seen was at 39°N.
6.3 Observations with IR
Vincendon, et al. [5959Vincendon M, Forget F, Mustard J. Water ice at low to midlatitudes on Mars. Journal of Geophysical Research. 2010;115:E10001. doi:10.1029/2010JE003584.] analyzed occurrences of H2O at the surface of Mars using near-infrared observations for latitudes between 45°S and 50°N. They assumed all H2O was ice but it is not clear whether they would have also detected mineral hydrates. In the North, most of the detected H2O was in the latitude range 40° to 50° with penetrations to the low 30s at a few longitudes. In the South, there was ample detection of H2O down to 20°S and a few penetrations below that. The sensitivity allowed detection down to water layers 1 to 2 microns thick, so they would pick up ground frost, which it likely was. Observations with IR is further discussed in Section 9 in connection with mineral hydrates.
Piqueux, et al. [6060Piqueux S, Buz J, Edwards CS, et al. Widespread shallow water ice on Mars at high latitudes and midlatitudes. Geophysical Research Letters. 2019;46. doi:10.1029/2019GL083947.] created a model based on measured seasonal surface temperature trends. When water ice in the subsurface is present close to the surface, the water ice absorbs and stores energy during spring/summer, resulting in slightly lowered temperatures at these seasons. Conversely, during the fall/winter, this heat is released and surface temperatures are elevated when compared to ice-free units. The amplitude of this effect can be predicted theoretically. The authors claimed: “When the ice/dry regolith interface is located within approximately one seasonal skin depth δ of the surface, that is, a few centimeters to ~1 m, and if the icy unit is thick enough (i.e., approaching one seasonal skin depth in thickness that is several meters for ice), this surface temperature expression can be detected with orbital assets. Other sources of regolith heterogeneities can complicate the interpretation of these temperature trends, but subsurface layering yields a unique seasonal that is difficult to emulate otherwise” [6060Piqueux S, Buz J, Edwards CS, et al. Widespread shallow water ice on Mars at high latitudes and midlatitudes. Geophysical Research Letters. 2019;46. doi:10.1029/2019GL083947.].
Using Mars Climate Sounder (MCS) data since 2006, Piqueux, et al. [6060Piqueux S, Buz J, Edwards CS, et al. Widespread shallow water ice on Mars at high latitudes and midlatitudes. Geophysical Research Letters. 2019;46. doi:10.1029/2019GL083947.] mapped the depth of the water table across Mars. They estimated the water table depth in the top meter at almost all longitudes for latitudes 60°< in North and South. In the North, they found many locations with water table depth in the top meter down to 40°N, and a few locations where it dipped down to about 35°N. They were unable to detect a water table between ±35° latitude.
They claimed: “We show that water ice is present sometimes just a few centimeters below the surface, at locations where future landing is realistic, under mobile material that could easily be moved around. This ice could be exploited on-site for drinking water, breathable oxygen, etc., at a much lower cost than if brought from Earth” – but this seems to contradict the neutron spectroscopy data. It will be interesting to see what ground truth reveals about these estimates.
6.4 Summary
Visual observations from orbit of ice on the surface of Mars provide the only significant “ground truth” that verifies that water ice is present. Many observations were made of crater ejecta where ice is seen amongst the ejecta, showing that ice was present prior to impact. These craters formed in the last few decades, constrained by repeat orbital imaging. Crater diameters ranged from 58 m down to <1 m. 1,203 crater sites were cataloged, of which 48 sites (4%) showed ice. Figure 15 shows that occurrence of ice in crater ejecta is almost exclusively limited to craters at 40° latitude and above, with a very few in the high thirties. Of particular interest is one very large crater that revealed ejecta large amounts of ice at 35°N latitude, indicating that near surface ice might persist below 40°N in some locations. Ice has also been detected at scarps and other sloped surface features, but typically for latitudes around 40°N or greater.
Thermal infrared analysis indicates that shallow ice is broadly available in the North down to about 35°N latitudes, but this seems to contradict the neutron data.
Geologists analyzed a wide variety of observations from orbit of land forms on the surface of Mars. In an impressive series of papers dating back even to the 1970s, geologists interpreted the- surface forms to infer the history and present state of several regions. Of particular interest are areas where steep slopes expose strata that would normally be buried, and also depressions left by near-surfaces where ice existed in the distant past, but now has sublimed. In both cases, as well as others, surface ice is gone, but ice might be lurking underneath, perhaps at only a few meters, perhaps at decimeters depth, or maybe not at all. Lacking ground truth in almost all instances, we must approach these claims with caution.
Butcher’s review provides a good entry to this topic [2222Butcher FEG. Water ice at mid-latitudes on Mars. In: Oxford Research Encyclopedia of Planetary Science. Oxford Research Encyclopedias. Oxford University Press; 2022. ISBN 9780190647926. doi:10.1093/acrefore/9780190647926.013.239.]. Broad, steep-sided valleys in Mars’ northern mid latitudes revealed deposits with lineated surface morphologies suggestive of ice-assisted flow of materials along valley floors and away from steep slopes centered around 40°N. Where these deposits filled valleys, they were called lineated valley fill; where they extended from the base of isolated hills and mesas, they were called lobate debris aprons; and where they were exposed on the sides of impact craters, they were named concentric crater fill. All of the above are referred to as “viscous flow features”. In addition, scalloped depressions were interpreted as thermokarst terrain attributed to loss of subsurface segregated ice over long time periods. Indeed, all of these formations reveal the ancient presence of large amounts of ice, now lost at the surface, but possibly hiding remnant ice at some depth. Some studies suggested that bulk water ice is covered by a “thin” (<10 m) layer of surficial debris, but this seems speculative.
On Earth, seasonal variations of temperature induce tensile stresses in ice-rich permafrost due to the expansion and contraction of the ground. It is observed that over time, the resulting near-surface strain presents as a network of self-organized polygonal fractures. Terrestrial polygons are typically modulated by freeze–thaw cycles where liquid water fills the cracks and prevents them from joining. Polygon development can also occur in the absence of liquid water within arid regions of Earth's permafrost. In active eolian environments, "sand-wedge" polygons can form, where infalling sand rather than water collects within the polygon cracks and prevents them from closing.
Polygonal structures are widely observed on Mars at so-called “mid-to-high latitudes”. Mangold, et al. [6161Mangold N, Maurice S, Feldman WC, Costard F, Forget F. Spatial relationships between patterned ground and ground ice detected by the Neutron Spectrometer on Mars. JGR Planets. 2004. doi:10.1029/2004JE002235.] found that most of the observed polygonal structures were distributed at latitudes poleward of ±55°. Mellon and Sizemore [1515Mellon MT, Sizemore HG. The history of ground ice at Jezero Crater Mars and other past, present, and future landing sites. Icarus. 2022;371:114667. doi:10.1016/j.icarus.2021.114667.] described the size and occurrence of polygons visible on Mars. Polygonal structures are visible at the Phoenix and Viking 2 landing sites. Ground ice was verified by Phoenix and is modeled to be stable at Viking 2. Morgan, et al. [6262Morgan GA, Putzig NE, Baker DMH, et al. Refined mapping of subsurface water ice on Mars to support future missions. The Planetary Science Journal. 2025;6:29. doi:10.3847/PSJ/ad9b24.] reviewed observation of polygonal structures on Mars. They concluded that typically, shallow ice (0 to 5 m) would exist in areas dominated by polygonal structures. Their Figure 7 indicates where polygonal structures were (and were not) observed across broad swaths of Mars. In the North, polygonal structures were seen at latitudes ranging from 30° to 42°, and in the South, from 35° to 42° over a 60-degree range of longitude. If indeed, polygonal structures do indicate near-surface ice on Mars, these observations would suggest that near-surface ice is far more available than had previously believed. It remains to validate these speculations with “ground truth”.
Gourronc, et al. [6363Gourronc M, Bourgeois O, Mège D, et al. One million cubic kilometers of fossil ice in Valles Marineris: relicts of a 3.5 Gy old glacial land system along the Martian equator. Geomorphology. 2014;204:235–255. doi:10.1016/j.geomorph.2013.08.009.] wrote an impressive paper in which they geologically analyzed a wide variety of surface features along the rugged Valles Marineris (straddling the Mars equator) to infer the ancient existence of huge ancient fossil ice deposits in a widespread glacial system. By analyzing photos of the surface, they identified dry surface features that indicated past ice, now depleted. They concluded that considerable relic ice should remain today beneath the surface. The article emphasizes the potential thickness of the putative remnant ice layer, but is not so clear regarding the dry overburden – if any. They mentioned models predicting ice stability at “decameters depth” but it is not clear whether the authors specifically estimated overburdens or merely postulated this estimate. Their Figure 11 seems to indicate ice exists under overburdens of a few decameters. This paper is a masterful use of geology to analyze the evolution of the Valles Marineris, but it doesn’t seem to have the ability to estimate the overburden, except by conjecture. As with all such analyses, we await “ground truth”.
Baker and Head [4747Baker DMH, Head JW. Extensive Middle Amazonian mantling of debris aprons and plains in Deuteronilus Mensae, Mars: implications for the record of mid-latitude glaciation. Icarus. 2015;260:269-288. Available from: https://citeseerx.ist.psu.edu/document?repid=rep1&type=pdf&doi=14f39b8bcd6c88f7460dcf9bf9d04ea2b2cac803] investigated extensive middle Amazonian mantling of debris aprons and plains in Deuteronilus Mensae in the latitude range 42°N to 45°N and 20°E to 36°E longitude. They conducted geomorphic mapping of debris aprons and plains units to assess evidence of former glacial extents and to elucidate the formation of surrounding plains units. Landforms diagnostic of the retreat of a more extensive cold-based ice sheet were not observed in the plains surrounding debris aprons. However, this observation does not preclude the existence of past ice sheets. A unique ‘‘upper plains’’ mantling unit was once more widespread across Deuteronilus Mensae and other regions in the mid-latitudes of Mars. The unit is up to 100 m in thickness, appears to be a mixture of dust and ice. It is possible that any glacial landforms in the plains surrounding debris aprons may be masked by this and other later mantling episodes. Possible remnants of glacial ice, marking retreat of a more extensive ice sheet, may be buried beneath the upper plains, as suggested by the presence of large collapse features within the unit that may result from sublimation of ice blocks at depth. The possible presence of subsurface ice remains speculative.
Concentric crater fills cover the floors of “mid-latitude” impact craters. They typically have concentric ridges and troughs on their surfaces. Butcher [2222Butcher FEG. Water ice at mid-latitudes on Mars. In: Oxford Research Encyclopedia of Planetary Science. Oxford Research Encyclopedias. Oxford University Press; 2022. ISBN 9780190647926. doi:10.1093/acrefore/9780190647926.013.239.] said “Viscous flow features are concentrated in the mid-latitude regions, between ~25–60°N/S” but his Figure 12 suggests mainly 35° to 50°. This composite shows the distribution of observed concentric crater fills, lobate debris aprons, lineated valley fills, glacier-like forms and other viscous flow features as “dots” of different color on a map of latitude vs. longitude. Concentric crater fills constitute the majority of dots, with lobate debris aprons forming a distant second in occurrence, and the others relatively rare. In the North, the data occurs mainly in a band from about 30°N to 48°N and in the South from about 35°S to 50°S. No dos occur in the ±30° latitude region.
A gully on Earth is a trench or a small valley formed by running water. On Mars, gullies are found as streaks on downslopes that show erosion to previous flows, and are described as typically having a head alcove, main and secondary channels, and depositional aprons, and are typically found on slopes of crater walls. Khuller and Christensen [6464Khuller AR, Christensen PR. Evidence of exposed dusty water ice within Martian gullies. JGR Planets. 2021;126(2):e2020JE006539. doi:10.1029/2020JE006539.] reviewed the various observations of gullies from orbit. Based on the light-toned materials brightness, they interpreted them to be water ice mixed with dust. They provided numerous examples of gullies on pole-facing, “mid-latitude” (30° to 60° latitude) slopes. Equator-facing slopes with gullies occurred poleward of ∼45–60° latitude. The lowest latitude where they investigated gullies was 33°S. These areas are interesting scientifically but unlikely to be suitable as landing sites. However, they might be useful in pointing to other ice on Mars at shallow depths.
Shean [6565Shean DE. Candidate ice-rich material within equatorial craters on Mars. Geophysical Research Letters. 2010. doi:10.1029/2010GL045181.] observed the floors and walls of 38 craters between 4°S and 13°S in the Sinus Sabaeus region that appear morphologically like material and landforms within mid-latitude craters. These mid-latitude craters were interpreted by some as covering subsurface ice. Shean provided several possible explanations for these formations, and subsurface ice is one possibility.
The NASA Phoenix Mars Lander at 68°N latitude confirmed the presence of water ice just beneath the Martian surface in 2008. The lander's robotic arm dug a trench and observed that bright, white material, initially suspected to be ice or salts, vaporized over a few days, indicating it was indeed water ice. The mission also identified two types of ice deposits: a brighter, slab-like ice and a darker, soil-like ice containing pore ice (Figure 17).
Figure 17: Near-surface ice revealed by digging on the Phoenix mission. Adapted from Reference [6666Science Magazine. Phoenix touches Martian ice. 2008. Available from: https://www.science.org/content/article/phoenix-touches-martian-ice].
Mineral hydrates are typically crystalline solids that include H2O molecules within the crystal structure in a simple arithmetic ratio to the mineral component. Common domestic mineral hydrates include gypsum (CaSO4•2H2O), borax (Na2B4O7•10H2O), and Epsom salts (MgSO4•7H2O). These compounds (and others) incorporate water molecules into their crystal structures and are typically found on Earth and on Mars. The wt % water content of these hydrates is gypsum: 19%, borax 48% and Epsom salts 51%. There are many other examples of hydrated minerals with water wt % typically in the range 20% to 50%.
Mineral hydrates have been observed by IR spectrometers from orbit to be widely distributed on the surface of Mars but might be hidden by desiccated dust. The surface dust on Mars is mainly composed of iron-bearing, anhydrous silicate material. It is a major source of bias because a dust mantling thicker than a few tens to hundreds of micrometers can entirely mask the underlying rock composition. As a result, an important fraction of the Martian surface is not accessible to remote sensing in the near infrared. Furthermore, observations from orbit only detect outcroppings at the surface and miss any submerged deposits of hydrated minerals. The observations from orbit always underestimate the distribution of mineral hydrates.
Most of the studies of mineral hydrates were carried out by planetary scientists interested in the evolution of minerals and water on of Mars over long time periods, rather than the practicality of currently accessing and utilizing mineral hydrates as a source of H2O to support missions. As a result, even though mineral hydrates are observed to occur widely, the potential for utilizing mineral hydrates for mission support remains uncertain.
Ehlmann and Edwards [6767Ehlmann BL, Edwards CS. Mineralogy of the Martian surface. Annual Review of Earth and Planetary Sciences. 2014;42:291–315. doi:10.1146/annurev-earth-060313-055024.] wrote a review of the vast increase in the number of observations of surface minerals on Mars. Their Table 1 provides a summary of minerals observed, including hydrated sulfates. Their Table 2 lists the various instruments that have been used, whether from orbit or from rover, and the typical size of pixels. The important CRISM resolution went down as low as 18 m.
Table 1: Review of layered ejecta craters (LECs) at the Planitas on Mars [3838Gou S, Yue Z, Di K, et al. Subsurface stratigraphy suggested by the layered ejecta craters in the Martian northern planitiae. Icarus. 2024;416:116100. doi:10.1016/j.icarus.2024.116100.].
Table 2: Summary of Data and Observations.
Audouard, et al. [6868Audouard J, Poulet F, Vincendon M, et al. Water in the Martian regolith from OMEGA/Mars Express. Journal of Geophysical Research: Planets. 2014;119(8):1969–1989. doi:10.1002/2014JE004649.] mapped the surface of Mars for more than ten years using the OMEGA imaging spectrometer (Vis/NIR and short-wave IR). They observed widespread H2O signals across the most of Mars with an average background of 4 wt % in the equatorial region, attributed to hydrated minerals on the surface. Three areas where hydrated minerals predominate include Nili Fossae (22°N, 75°E) (phylosilicates), Juventae Chasma (3.5°S, 61°W), and Henry Crater (10°N, 23°E), with widely spread hydrated sulfate deposits [2121Pathare AV, Feldman WC, Prettyman TH, Maurice S. Driven by excess? Climatic implications of new global mapping of near-surface water-equivalent hydrogen on Mars. Icarus. 2018;301:97-116. doi:10.1016/j.icarus.2017.09.031.,6969Gross C, Al-Samir M, Bishop JL, Poulet F, Postberg F, Schubert D. Prospecting in-situ resources for future crewed missions to Mars. Acta Astronautica. 2024;223:15–24. doi:10.1016/j.actaastro.2024.07.003.]. Riu, et al. [7070Riu L, Carter J, Poulet F, Cardesín-Moinelo A, Martin P. Global surficial water content stored in hydrated silicates at Mars from OMEGA/MEx. Icarus. 2023;398:115537. doi:10.1016/j.icarus.2023.115537.] found that hydrated silicates typically provided 5 wt % H2O and in some places up to 20%. Mustard, et al. [7171Mustard JF, Murchie SL, Pelkey SM, Ehlmann BL, Milliken RE, Grant JA, Bibring JP, Poulet F, Bishop J, Dobrea EN, Roach L, Seelos F, Arvidson RE, Wiseman S, Green R, Hash C, Humm D, Malaret E, McGovern JA, Seelos K, Clancy T, Clark R, Marais DD, Izenberg N, Knudson A, Langevin Y, Martin T, McGuire P, Morris R, Robinson M, Roush T, Smith M, Swayze G, Taylor H, Titus T, Wolff M. Hydrated silicate minerals on Mars observed by the Mars Reconnaissance Orbiter CRISM instrument. Nature. 2008 Jul 17;454(7202):305-9. doi: 10.1038/nature07097. Epub 2008 Jul 16. PMID: 18633411.] found widespread evidence of phylosilicates.
Numerous observations from orbit have shown the presence of hydrated minerals widely spread across equatorial Mars. Wernicke and Jakosky [7272Wernicke LJ, Jakosky BM. Martian hydrated minerals: a significant water sink. JGR Planets. 2021;126(3):e2019JE006351. doi:10.1029/2019JE006351.] performed a global review and analysis of mineral hydrates on Mars, providing a wealth of information.
Mustard, et al. [] pointed out that every near infrared spectrum of Mars shows clear evidence for the presence of water in the regolith surface, indicated by a strong absorption near 3 μm. Various mineral hydrates are evidently widely spread across Mars. Mustard, et al. [] provided a list of hydrated minerals detected on Mars in their Table 8.1. The estimated water abundance of Martian soils is 2 to 4 wt% H2O at equatorial and mid-latitudes. This is almost certainly due to presence of hydrated minerals.
Sulfates received particular attention because they are widely available and have relative lower temperature requirements to remove the H2O from the hydrates. For example, Siljeström, et al. [7474Siljeström S, Czaja AD, Corpolongo A, et al. Evidence of sulfate-rich fluid alteration in Jezero Crater floor, Mars. JGR Planets. 2024;129(1):e2023JE007989. doi:10.1029/2023JE007989.] reported the presence of hydrated magnesium sulfate (similar to Epsom salts) and dehydrated calcium sulfate at Jezero Crater. Karunatillake, et al. [7575Karunatillake S, Wray JJ, Gasnault O, et al. Sulfates hydrating bulk soil in the Martian low and middle latitudes. Geophysical Research Letters. 2014;41(22):7987–7996. doi:10.1002/2014GL061136.] showed that the distribution of near-surface sulfates on Mars is similar to the distribution of H2O in the equatorial region, as revealed by neutron spectroscopy (Figures 5-7). Vaniman, et al. [7676Vaniman D, Chipera S, Rampe E, et al. Gypsum on Mars: a detailed view at Gale Crater. Minerals. 2024;14(8):815. doi:10.3390/min14080815.] summarized the associations of gypsum with other sulfate minerals at Gale Crater. They estimated the weight percentage of various sulfate hydrated minerals at many locations at Gale Crater. Most of the sites had percentages in the range around 7% but several had around 12%, and one site had about 20%, most of which was gypsum. Clark, et al. [7777Clark BC, Morris RV, McLennan SM. Chemistry and mineralogy of outcrops at Meridiani Planum. Earth Planet Sci Lett. 2005;240(1):73–94. doi:10.1016/j.epsl.2005.09.040.] reported that outcrops analyzed by the Opportunity rover at Meridiani Planum contain 6–22 wt.% water, primarily in hydrated sulfates, and estimated that soils in the Meridiani Planum contain 1–4 wt.% water. Some outcrops might be pure gypsum? Ralphs, et al. [7878Ralphs M, Franz B, Baker T, Howe S. Water extraction on Mars for an expanding human colony. Life Sci Space Res (Amst). 2015 Nov;7:57-60. doi: 10.1016/j.lssr.2015.10.001. Epub 2015 Oct 22. PMID: 26553638.] considered sulfates for production of water on Mars.
Carter, et al. [7979Carter J, Poulet F, Bibring J-P, Mangold N, Murchie S. Hydrous minerals on Mars as seen by the CRISM and OMEGA imaging spectrometers: updated global view. JGR Planets. 2013;118:831–858. doi:10.1029/2012JE004145.] summarized high resolution observations by CRISM and OMEGA imaging spectrometers from orbit. The OMEGA instrument detected Fe/Mg-rich phyllosilicates (nontronite), Al-rich phyllosilicates, and hydrated sulfates in five regions of Mars down to a resolution of about 500 m to 4.1 km. The CRISM instrument found hundreds of hydrous mineral exposures scattered over the southern highlands, including hydrated sulfates (including bassanite and gypsum), the hydroxylated sulfates jarosite and alunite. The resolution was as low as 18 m. Figure 18 shows the locations where hydrous minerals were detected. Figure 19 shows where heavily dusted areas probably shielded hydrous minerals from detection. Their summary of minerals identified included seven sulfates (in their Table 1). Carter, et al. [7979Carter J, Poulet F, Bibring J-P, Mangold N, Murchie S. Hydrous minerals on Mars as seen by the CRISM and OMEGA imaging spectrometers: updated global view. JGR Planets. 2013;118:831–858. doi:10.1029/2012JE004145.] estimated the amount of water stored in hydrated minerals on Mars assuming 3% of the surface is covered with hydrated minerals (containing 10% H2O) to a depth of 10 km, and found enough H2O to cover Mars to depth ~30 m. While this is not an unreasonable assumption, it is a very speculative guess. No estimate was made of accessible H2O.
Figure 18: Global map of hydrous mineral detections on Mars. Each dot indicates the position of a hydrous mineral exposure detected either by CRISM (red), OMEGA (blue) or jointly by both instruments (orange). Only one exposure is counted per CRISM observation regardless of the number of different hydrous mineral species found. Adapted from Figure 1 of Carter, et al. [7979Carter J, Poulet F, Bibring J-P, Mangold N, Murchie S. Hydrous minerals on Mars as seen by the CRISM and OMEGA imaging spectrometers: updated global view. JGR Planets. 2013;118:831–858. doi:10.1029/2012JE004145.].
Figure 19: Comparison of hydrous mineral exposures to very dusty regions (yellow to orange). . Adapted from Figure 4 of Carter, et al. [7979Carter J, Poulet F, Bibring J-P, Mangold N, Murchie S. Hydrous minerals on Mars as seen by the CRISM and OMEGA imaging spectrometers: updated global view. JGR Planets. 2013;118:831–858. doi:10.1029/2012JE004145.].
Murchie, et al. [8080Murchie SL, Ehlmann BL, Arvidson RE. Geological water resources for humans on Mars: constraints from orbital spectral mapping and in situ measurements. Lunar Planet Sci. 2016;47:abstract #1261.] estimated water recovery percentages from mineral hydrate resources in various assumed soil mixtures and found that some formations enriched in aqueous minerals may have 2–10 wt.% bound H2O in sulfate, carbonate, or clay, recoverable (depending on the phase) by heating to 100– 250 °C. They did not consider outcrops of pure minerals.
Murchie, et al. [8181Murchie SL, Arvidson RE, Bishop JL, et al. Maximizing the science and resource mapping potential of orbital VSWIR spectral measurements of Mars. Planetary Science and Astrobiology Decadal Survey 2023-2032 white paper. Bull Am Astron Soc. 2021;53(4):e-id. 119.] emphasized the great improvement in spatial resolution that has taken place in IR observations from orbit of mineral hydrates and indicated potential for further improvement. This is a rather odd paper with 23 authors and 10 “signatories” – whatever that means? – yet the paper is rather short. Their section on “convergence of science and resource mapping” is relevant to the present review of H2O on Mars because most of the IR measurements of surface minerals were scientific, and the implications for using mineral hydrates as a resource for mission support was not usually considered. However, their coverage of the topic was minimal. They emphasized that mineral hydrates could be important at latitudes 35°< “at which shallow near-surface ice has not been detected”. Based on Murchie, et al. [8181Murchie SL, Arvidson RE, Bishop JL, et al. Maximizing the science and resource mapping potential of orbital VSWIR spectral measurements of Mars. Planetary Science and Astrobiology Decadal Survey 2023-2032 white paper. Bull Am Astron Soc. 2021;53(4):e-id. 119.] they claimed that “a synthesis of orbital estimates and ground truth measurements of water abundance makes it possible to estimate the water recoverable from various formations”. However, it is not clear how observations of the surface reveal content of minerals well below the surface.
Viola, et al. [22Viola D, McEwen AS, Dundas CM. Mid-latitude Martian ice as a target for human exploration, astrobiology, and in-situ resource utilization. First Landing Site/Exploration Zone Workshop for Human Missions to the Surface of Mars. 2015. Available from: https://www.hou.usra.edu/meetings/explorationzone2015/pdf/1011.pdf] described potential resources for practical use as ice filling pores in regolith, “excess ice” – meaning volumes of ice that exceed the available pore space, and mineral hydrates. They said “Since Martian excess ice is thought to contain a low fraction of dust and other contaminants only a modest deposit of excess ice will be sufficient to support a human presence”. That depends on the mission design. However, as Rapp [33Rapp D. Will SpaceX send humans to Mars in 2028? IgMin Res. 2024 Dec 13;2(12):969-983. IgMin ID: igmin274. doi: 10.61927/igmin274. Available from: igmin.link/p274,44Rapp D. Preparing for SpaceX mission to Mars. IgMin Res. 2025 Mar 4;3(3):123-132. IgMin ID: igmin292. doi: 10.61927/igmin292. Available from: igmin.link/p292] showed, a SpaceX human expedition to Mars using the Starship would require about 1,000 tons of water to produce propellants for returning from Mars. That would require a very extensive source of H2O.
Viola, et al. [22Viola D, McEwen AS, Dundas CM. Mid-latitude Martian ice as a target for human exploration, astrobiology, and in-situ resource utilization. First Landing Site/Exploration Zone Workshop for Human Missions to the Surface of Mars. 2015. Available from: https://www.hou.usra.edu/meetings/explorationzone2015/pdf/1011.pdf] proposed two Exploration Zones in the northern mid-latitudes of Mars in the vicinity of Arcadia and Amazonis Planitiae.
In particular, Erebus Montes site is centered near 192.1°E, 39.0°N. The region includes several generic indications that near surface ice might be present (such as ice-altered secondary craters and ice-rich lobate debris aprons) and an ice-exposing impact was identified within this zone. However, note that Figure 15 indicates that ice-exposing impacts tend to occur at higher latitudes.
The proposed Acheron Fossae site is centered near 220.6°E, 39.8°N. They argued that this region is likely to contain ice and claimed that “the Gamma Ray Spectrometer water map suggests that there is abundant subsurface ice in the uppermost meter within this region” although we could only find evidence of weak hydrogen deposits in Figures 5,6.
Both sites are at very desirable low elevations (-3.98 km and -3.15 km relative to MOLA Datum) to facilitate Entry, Descent, and Landing. The terrains are relatively flat. However, H2O near 40°N latitude does not fit our criteria for accessible H2O.
Golombek, et al. [11Golombek M, Williams N, Wooster P, et al. SpaceX Starship landing sites on Mars. 52nd Lunar and Planetary Science Conference 2021. 2022; (LPI Contrib. No. 2548).] pointed out that engineering constraints on potential landing sites are mostly related to elevation, latitude, surface slopes, rocks, and the presence of a load bearing surface. SpaceX claims that the Starship intends to use terrain relative navigation to attain a small landing ellipse (circle) less than 200 m in diameter.
Golombek, et al. [11Golombek M, Williams N, Wooster P, et al. SpaceX Starship landing sites on Mars. 52nd Lunar and Planetary Science Conference 2021. 2022; (LPI Contrib. No. 2548).] asserted:
“An elevation below -2 km with respect to the MOLA Datum geoid that can support the delivery of large payloads, with <-3 km preferred for increased performance. Latitude must be <40° for solar power and thermal management, and closer to the equator is desirable. Multiple separate landing locations spaced within a few km of each other, to support the multiple missions needed to grow an outpost, are required as retro-rockets used during landing may modify the surface (or damage pre-existing infrastructure). Slopes should be <5° over a 10 m length scale and the chance of impacting a rock greater than 0.5 m high (1 m diameter) should be <5%. Finally, the landing site must be radar reflective to enable measurement of the distance to the surface, and it must be load-bearing to support the spacecraft at touchdown. The landing site must be close to significant deposits of water/ice, a required resource for in situ propellant production and a consumable to support habitation” [11Golombek M, Williams N, Wooster P, et al. SpaceX Starship landing sites on Mars. 52nd Lunar and Planetary Science Conference 2021. 2022; (LPI Contrib. No. 2548).].
They described how in several workshops, they explored these requirements and came up with several proposed landing sites.
In regard to slope, we were very surprised at allowance for slopes up to 5° which is an 8.7% grade providing what appears to us to be an unwieldy and dangerous base.
In regard to rock distributions, M. Golombek and co-workers developed methods to estimate rock distributions at any site, starting with a simpler approach in 1997 [8282Golombek M, Rapp D. Size-frequency distributions of rocks on Mars and Earth analog sites: implications for future landed missions. JGR. 1997;102:4117–4129.] and developed into sophisticated tools by 2012 [8383Golombek M, Huertas A, Kipp D, Calef F. Rock abundance maps of the final four Mars Science Laboratory landing sites. Mars J. 2012;7:1–22. doi:10.1555/mars.2012.0001.]. These were used to appraise the various sites for safe landing.
Most of the sites considered had elevation of about -3.9 km relative to the MOLA Datum – excellent for EDL.
The potential availability of accessible ice was discussed. They said:
“Mid-latitude ground-ice has been observed by neutron spectroscopy [ref.1], radar reflections [ref.2], analogous ice-related morphologies including polygonal patterned ground [ref.3], ice in fresh crater ejecta [ref.4] and has been observed just below the surface by the Phoenix lander [ref.5]. Hundreds of meters thick local ice deposits expressed as lobate debris aprons (LDAs) adjacent to Montes exhibit viscous flow morphologies and have radar reflectors with dielectric constants similar to nearly pure ice [ref.6].”
Their [ref.1] refers to our Section 4.2.2, and we can’t find any evidence of near-surface ice at these locations in Figures 5,6. Their [ref.2] and [ref.4] are discussed in our Section 6.1, and as Figure 13 indicates, the area north of 40°N might provide ice-rich regions for exploitation, but 40°N is the ragged edge below which little ice is found. The argument for ice based on their [ref.2] and their [ref.3] has some merit, but is less than convincing to us at this stage. The Phoenix Lander at 68°N latitude is completely irrelevant. Relevant to their [ref.6] our Section 5.5 summarizes radar findings, some of which provide support, but leave much unanswered. The weakness in the proposed landing sites is the still uncertain availability of accessible ice.
Evidently, members of the Mars community are moving forward via workshops and publications to advocate landing sites close to 40°N. Probably, this is based on the fact that accessible ice is a fundamental requirement for a landing site for a large-scale human venture to Mars, and as Figure 15 indicates, prospects for accessible ice at latitudes less than 40°N are not impressive despite occasional evidence such as the crater at 35°N (Figure 16). But even at 40°N the evidence for accessible ice lacks ground truth. Furthermore, mineral hydrates might be available at equatorial sites, and this seems to have dropped through the planning cracks.
Golombek, et al. [11Golombek M, Williams N, Wooster P, et al. SpaceX Starship landing sites on Mars. 52nd Lunar and Planetary Science Conference 2021. 2022; (LPI Contrib. No. 2548).] said: “Multiple separate landing locations spaced within a few km of each other, to support the multiple missions needed to grow an outpost.” However, it is necessary to establish a first human landing before considering an outpost. The advent of the Starship enables potential synoptic scientific exploration of much of Mars, rather than the present state where a few very small areas are explored by Earth-managed rovers. There seems to be a widespread optimism about availability of accessible ice on Mars in the Mars community. Each new observation of ice (and we admit there have been many of them) is published almost like a press release rather than a scientific report. Figure 15 provides a sobering antidote. It is also important to report where ice is not found. Furthermore, some publications do not specify latitudes and overburdens. The advent of the Starship will enable more extensive and detailed search for H2O. For example, we can imagine a Starship mission to send 100 1-ton penetrators from orbit to create craters at important locations, or alternatively, a low flying Starship at 150 km altitude to increase resolution of neutron spectroscopy and cameras.
Finally, we raise the question of what range of Mars latitudes would be acceptable for a human mission to Mars. If we were Martians and wanted land on Earth, would we want to land at 40°N latitude? We have been laboring under the impression that the potential range of possibly acceptable latitudes is ±30° with a very strong preference for near-equatorial locations. Despite the very good work done by Golombek, et al. [11Golombek M, Williams N, Wooster P, et al. SpaceX Starship landing sites on Mars. 52nd Lunar and Planetary Science Conference 2021. 2022; (LPI Contrib. No. 2548).], we still wonder if these landing sites are desirable for a human mission. If NASA diverted its seemingly futile search for life to a search for H2O, we might find viable sources of H2O at lesser latitudes.
Morgan, et al. [6262Morgan GA, Putzig NE, Baker DMH, et al. Refined mapping of subsurface water ice on Mars to support future missions. The Planetary Science Journal. 2025;6:29. doi:10.3847/PSJ/ad9b24.] described the Mars Subsurface Water Ice Mapping (SWIM) project to assemble data to map out buried ice. Through integration of all appropriate orbital data sets, the SWIM project claims to produce ∼3 km pixel−1 ice consistency maps of Mars over depth ranges of 0–1 m, 1–5 m, and >5 m. The SWIM project traces the likely distribution of ice below the Martian surface between 60° N and 60°S. The approach involves integration of all available relevant orbital data sets to map out the near-surface distribution of ice on Mars. They combined results from neutron spectroscopy from orbit, radar from orbit, thermal inertia mapping and geomorphology to estimate the distribution of near-surface ice at various depths across the realm of latitude ± 60° for elevations less than +1 km relative to the MOLA Datum. Algorithms were created to interpolate and extrapolate the limited data. The results were reported in their Figure 9 as three plots. One was for ice at depth 0-1 m, a second for ice at depth 1-5 m, and the third for ice at depth > 5 m. However, their ice consistency formula appears to be a sum of five contributions whenever they were positive, and they did not allow any contribution to go negative where nothing was found. For example, the results shown in Figure 15 might be a data source in favor of essentially no ice between ±40° latitude, but apparently, no negative data was considered.
The map for ice at depth 0-1 m approximately followed the findings of the neutron spectroscopy data as shown in Figure 6, with most of the H2O at latitudes greater than 50°, but some penetration of near surface H2O down to about 40° or possibly lower in the Arcadia Planita and Utopia Planita regions. The equatorward distribution of H2O is more pronounced in the North than the South. Their Table 2 shows that almost all their relevant sites were for latitudes 40° to 60°. Here, we describe the findings as H2O because these measurements can’t distinguish between ice and mineral hydrates. The H2O is almost certainly ice at the higher latitudes, but at latitudes of 40° or less, we are uncertain. The article appears to assume it is ice at all latitudes.
The map for 1-5 m shows ice at these depths to be stable at all longitudes, for latitudes from 60°N down to 30°N, and for two limited longitudes at latitudes from 60°S down to 30°S. While Figure 9 shows extensive data from concentric crater fill distributed between ±30° to ±50°, the other four sources of data in Figure 9 tend to be centered around ±40°, reaching down at a few longitudes toward the low 30s. We think that until “ground truth” is available to support these claims, they should be regarded with some caution. Note that their Figure 10 presents a more optimistic view than our Figure 15.
The map for >5 m mainly mirrors the map for 1-5 m, except there is less ice at >5 m than for 1-5 m, which seems surprising.
It would have been helpful, had they provided a table of sites (analogous to their Table 2 for the 0-1 m case) for the 1-5 m and > 5 m cases. In making the startling claim that ice at 1-5 m depth is available essentially everywhere on Mars from 60°N to 30°N, they ought to support this with tabular data. We are doubtful that the extent and precision of the underlying data merit the detailed conclusions in this paper. The optimism in this paper seems excessive.
In this review, we focused on the search for H2O that is accessible for utilization by missions to Mars. We imagine a human mission to Mars patterned after the SpaceX mission utilizing the Starship, and requiring large amounts of hydrogen for producing propellants for the return trip [33Rapp D. Will SpaceX send humans to Mars in 2028? IgMin Res. 2024 Dec 13;2(12):969-983. IgMin ID: igmin274. doi: 10.61927/igmin274. Available from: igmin.link/p274,44Rapp D. Preparing for SpaceX mission to Mars. IgMin Res. 2025 Mar 4;3(3):123-132. IgMin ID: igmin292. doi: 10.61927/igmin292. Available from: igmin.link/p292,9090Rapp D. Human missions to Mars using the Starship. IgMin Res. Submitted July 2025.]. In that connection, the three parameters that guide us as to the useful deposits are (1) the latitude, (2) the depth, and (3) the elevation.
Two decades ago, neutron spectra and initial stability models suggested that near-surface ice on Mars was likely to be rare equatorward of about 50° latitude, with some penetration into the forties. Since then, observation after observation from orbit has revealed the likely presence of huge amounts of ice within the subsurface of Mars, at various depths at lower latitudes. As a result, the pendulum has swung to the point that some enthusiastically suggest that near-surface ground ice occurs almost everywhere on Mars. However, a sober, skeptical review of the data shows that near-surface ice has been observed, spectra and radar have indicated, and ground features have been interpreted to indicate that in wide areas of Mars, shallow ice apparently occurs widely at latitudes greater than 40° and at a few locations, persists into the 30s. Further study with much higher resolution might possibly reveal shallow ice at lower altitudes in unique locations.
H2O occurs on Mars as mineral hydration, ice filling in pores of regolith, and sheets of continuous ice. Some publications take it for granted that observed H2O is ice, and that is probably correct at higher latitudes, but might not be so at lower latitudes.
Generally, the lower the latitude, the better suited the endowed H2O is for missions. There is no fixed range of latitude that is regarded as acceptable for human missions. Several workshops were held on landing site selection for a putative human mission to Mars, beginning with the important 2015 workshop where several hundred attended and about 40 papers were presented [9292Bussey B, Hoffman SJ. Human Mars landing site and impacts on Mars surface operations. 2016 IEEE Aerospace Conference. 2016. doi:10.1109/AERO.2016.7500775. Available from: https://ntrs.nasa.gov/api/citations/20160001040/downloads/20160001040.pdf]. This workshop concluded that availability of indigenous Martian H2O was the driving factor in site selection for a human mission to Mars. The guidelines for the 2015 workshop were to seek landing sites within the latitude range ± 50°. Further studies delved deeper into requirements for a human mission to Mars. Golombek, et al. [11Golombek M, Williams N, Wooster P, et al. SpaceX Starship landing sites on Mars. 52nd Lunar and Planetary Science Conference 2021. 2022; (LPI Contrib. No. 2548).] and Viola, et al. [22Viola D, McEwen AS, Dundas CM. Mid-latitude Martian ice as a target for human exploration, astrobiology, and in-situ resource utilization. First Landing Site/Exploration Zone Workshop for Human Missions to the Surface of Mars. 2015. Available from: https://www.hou.usra.edu/meetings/explorationzone2015/pdf/1011.pdf] considered sites at 39°N to be viable. Our perspective is that ±20° would be ideal, and perhaps up to ±30° might be acceptable if all the other factors were favorable. This remains a point of controversy. Would the first human mission to Mars be landed at 39°N? We doubt it. However, the majority of key people in the field are willing to consider higher altitudes because that is where accessible water is far more likely to be found. Despite our misgivings about landing at higher latitudes, we have reviewed availability of H2O between ± 50° latitude, and most of the likely H2O occurs above 40°N.
There is also no firm maximum acceptable depth, but a lesser depth below the surface is better. Obviously, resources right at the surface are ideal. Ice resources at depths to perhaps 5 m ought to be accessible in the near term. In a distant, hypothetical SpaceX large-scale settlement, drilling down 500 m might even be conceptually possible. For our purposes, thinking about the first human mission to Mars, we focus on resources in the upper 5 m.
Sites with elevation at least 2 km lower than the MOLA Datum are greatly preferred to enhance entry, descent and landing (EDL). The Golombek, et al. [11Golombek M, Williams N, Wooster P, et al. SpaceX Starship landing sites on Mars. 52nd Lunar and Planetary Science Conference 2021. 2022; (LPI Contrib. No. 2548).] study listed sites ranging from -3 km to -3.9 km relative to the MOLA Datum.
We reviewed reports of analyses and observations implying distribution of H2O, as well as actual visual identification of surface ice on Mars. Some of these reports were vague regarding the latitudes, especially the lowest latitudes in the study. Many did not report much detail on the depth of the ice, and most papers did not provide information on the elevation. It is important that each published paper on H2O on Mars provide this information, yet most published papers are lacking. It is particularly important that published papers should elucidate in detail any findings at the lowest latitudes in the observation program. In addition, it is equally important to show where ice was not found or predicted, as well as where it was found or predicted.
Neutron spectroscopy from orbit provides a synoptic view of the entire planet of Mars. However, the observations are limited to the top ~ 1 m of subsurface, the spatial resolution was initially 600 km (but has recently been reduced to about 200 km), and the instrument detects hydrogen and cannot distinguish between mineral hydrates and ice. It was found that near-surface hydrogen is mainly confined to latitudes greater than 50° with some penetration down to the 40s in the North at some longitudes. Lesser deposits of H2O were also seen at some equatorial locations. The recent improvement in resolution by the Russian-Euro group shows that as the resolution is increased, we are better able to discern local high concentrations of hydrogen. One very important aspect of these observations is that they place a limit on the amount of hydrogen in the top one meter, and therefore other observations of ice on the surface must conform to the neutron spectroscopy observations.
Radar observations are compatible with huge layers of ice buried 300 m to 600 m below the surface at an equatorial location. This suggests that substantial ice layers at depth might occur at other locations on Mars, even some equatorial locations. These putative ice deposits are unlikely to be accessible in the near term, but might be accessible in the more distant future. Radar observations concluded that the Arcadia Planita and Utopia Planitia Regions have significant amounts of near-surface ice. However, it is not clear how far South these deposits persist. In particular, does any of it occur below 40°N latitude? Radar observations of lobate debris aprons lead to the same story. Plenty of ice was implied, but the latitude dependence is murky. In particular it is not clear whether these ice deposits persist to latitudes less than 40°. A few limited rover-based radar observations were made but these were not in locations where ice is expected to be found.
Visual observations from orbit of ice on the surface of Mars depend mainly on observations of ice ejected from recent craters. 1,203 crater sites were cataloged, of which 48 sites (4%) showed ice. No trends were found in the occurrences of clusters with latitude, elevation, or impact size. Occurrence of ice is almost exclusively limited to craters at 40° latitude and above, with a very few in the high thirties. Of particular interest is one very large crater that revealed ejecta ice at 35°N latitude, indicating that rarely, near surface ice might persist below 40°N. Ice has also been detected at scarps and other sloped surface features, but typically for latitudes greater than 40°N.
Geologists have interpreted a wide range of morphological structures over wide areas on the surface of Mars as revealed by photos taken from orbit, as indicators of ancient heavy glaciation, with the uppermost layer now desiccated and remnant ice remaining at some depth in the subsurface. The prevailing view is that the ice is not deep (10 m <), but this remains speculative. Most of these structures were seen at latitudes > 40° but some were down to 30° and require further examination.
The average water content in almost any 1,500 km x 1,500 km area on Mars is expected to be in the range 2-4% wt % H2O, corresponding to an average concentration of mineral hydrates of perhaps 6-12 wt %, depending on which hydrates are prevalent. The resolution of instruments is not high enough to resolve the distribution of mineral hydrates within a pixel. If there are local outcrops that are heavily endowed with mineral hydrates at say, 80-100 wt % mineral hydrates, exploiting mineral hydrates might be efficient. The prospects for utilizing mineral hydrates as a source of water on Mars remain uncertain, but should not be neglected in the current focus on ice.
A summary of findings is given in Table 2.
Table 2 summarizes findings at all latitudes. Most of the observed or inferred accessible H2O on Mars occurs outside the ± 30° latitude zone. Within the ± 30° latitude zone, we have the following observations:
Rover-based radar did not detect H2O. [50 to 5550 to 55Hamran S-E, Paige DA, Amundsen HEF. Radar Imager for Mars’ Subsurface Experiment (RIMFAX). Space Sci Rev. 2020;216:128. doi:10.1007/s11214-020-00740-4.]
Radar observation of The Medusae Fossae Formation from orbit detected thick layers of buried ice buried beneath several hundred m of Martian soil [3232Watters TR, Campbell BA, Leuschen CJ, et al. Evidence of ice-rich layered deposits in the Medusae Fossae Formation of Mars. Geophysical Research Letters. 2023. doi:10.1029/2023GL105490.,3333Fastook JL, Head JW. Origin of ice in the Medusae Fossae Formation, equatorial Mars. Icarus. 2024;421:116226. doi:10.1016/j.icarus.2024.116226.].
Neutron spectra from orbit provides the best available observations of the equatorial area. The original Odyssey observations as shown in Figures 5,6 showed relatively sparse, low concentrations of H2O, although a few local areas had indications of significant H2O content, possibly up to 6% WEH [55Rapp D. Human Missions to Mars. 2nd ed. 2012; 3rd ed. 2023. Heidelberg (Germany): Springer-Praxis Books; Springer. Appendix A: Solar energy on Mars. Appendix C: Water on Mars.,1919Feldman WC, Prettyman TH, Maurice S, et al. Global distribution of near-surface hydrogen on Mars. J Geophys Res. 2004;109:E09006.,2222Butcher FEG. Water ice at mid-latitudes on Mars. In: Oxford Research Encyclopedia of Planetary Science. Oxford Research Encyclopedias. Oxford University Press; 2022. ISBN 9780190647926. doi:10.1093/acrefore/9780190647926.013.239.]. In later FREND observations at higher resolution, some areas were observed at about 8% WEH. Two areas with the highest apparent WEH were: WEH = 23% at -17° N latitude, and WEH = 24% at 8° N latitude. The authors suggested that random errors accumulated, and the actual values might be about 16%. In both cases, the outline of high WEH follows the altitude contours quite closely. One does not expect relict ice to remain in the upper meter at low latitudes, but on the other hand, this would require a very large endowment of hydrated minerals that is not confirmed by IR observations. Pushing their resolution to the highest possible value, it was claimed that a WEH of 40.3% was found at 7°S latitude. However, further analysis showed this data was not compatible with lower resolution data and appears to be faulty.
While accessible ice is not expected to be available in the ± 30° latitude range, there are indications that some very local areas might provide accessible H2O. at useful levels of WEH. The search for such deposits requires much higher resolution than is presently available.
Finally, it is important to point out the background of structurally bound or adsorbed water in typical Mars soil. Mars Odyssey's Neutron Spectrometer measurements are calibrated assuming that many low- to mid-latitude regions of Mars contain ~2 wt% water-equivalent hydrogen (WEH) in the upper meter of regolith — a value both observed in the data and widely used as a baseline assumption in two-layer hydrogen distribution models [1919Feldman WC, Prettyman TH, Maurice S, et al. Global distribution of near-surface hydrogen on Mars. J Geophys Res. 2004;109:E09006.]. This hydration is not attributed to surface ice in these thermodynamically unstable equatorial zones but rather to structurally bound or adsorbed water within hydrous silicate and salt hydrate minerals.
Spectroscopic evidence from CRISM and OMEGA confirms that hydrated minerals are prevalent in equatorial regions, particularly in ancient Noachian terrains and clay-rich fluvial-lacustrine deposits. These include phyllosilicates, hydrated sulfates, and amorphous silica, which can contain up to 10–15 wt% H₂O in structurally bound form [6767Ehlmann BL, Edwards CS. Mineralogy of the Martian surface. Annual Review of Earth and Planetary Sciences. 2014;42:291–315. doi:10.1146/annurev-earth-060313-055024.].
In addition to these well-documented hydrous phases, the Martian regolith contains aluminium and titanium oxides, detected consistently at multiple landing sites at levels of ~10 wt% Al₂O₃ and ~1 wt% TiO₂ [9393Ming DW, Morris RV. Chemical, mineralogical, and physical properties of Martian dust and soil. Meeting: Dust in the Atmosphere of Mars and Its Impact on Human Exploration Workshop, Houston, TX, June 13–15, 2017.]. These primary oxides, while potentially less voluminous than the globally widespread phyllosilicates (clay minerals) found in the Noachian crust, represent important components of the regolith matrix. They are strongly hydrophilic, with water contact angles typically below 15°, and stabilize thin water films through hydrogen bonding and surface hydroxylation [4141Wang Y, Feng X, Zhou H, et al. Water ice detection research in Utopia Planitia based on simulation of Mars rover full-polarimetric subsurface penetrating radar. Remote Sensing (MDPI). 2022. Special issue: Advanced Ground Penetrating Radar Theory and Applications.,9494Benkoula S, Sublemontier O, Patanen M, Nicolas C, Sirotti F, Naitabdi A, Gaie-Levrel F, Antonsson E, Aureau D, Ouf FX, Wada S, Etcheberry A, Ueda K, Miron C. Water adsorption on TiO2 surfaces probed by soft X-ray spectroscopies: bulk materials vs. isolated nanoparticles. Sci Rep. 2015 Oct 14;5:15088. doi: 10.1038/srep15088. PMID: 26462615; PMCID: PMC4604456.].
Zirconium (Zr) is present only in trace amounts in Martian regolith but recent remote sensing and grain analyses suggest localized enrichment in Zr-bearing heavy minerals, reaching a maximum of 3 g/kg [025025Mitrofanov IG, Litvak ML, Varenikov AB, et al. Dynamic Albedo of Neutrons (DAN) experiment onboard NASA’s Mars Science Laboratory. Space Sci Rev. 2012;170:559-582.-0000100001Golombek M, Williams N, Wooster P, et al. SpaceX Starship landing sites on Mars. 52nd Lunar and Planetary Science Conference 2021. 2022; (LPI Contrib. No. 2548).-88Chamberlain MA, Boynton WV. Response of Martian ground ice to orbit-induced climate change. J Geophys Res Planets. 2007;112. doi: 10.1029/2006JE002801.]. Where present, ZrO₂ (zirconia) surfaces are strongly hydrophilic, with contact angles as low as ~12°, and can bind water at defect-rich sites via dissociative adsorption [9696Rudakova AV, Maevskaya MV, Emeline AV, Bahnemann DW. Light-Controlled ZrO2 Surface Hydrophilicity. Sci Rep. 2016 Oct 5;6:34285. doi: 10.1038/srep34285. PMID: 27703174; PMCID: PMC5050454.].
While the literature does not explicitly attribute the ~2% WEH background to oxide surfaces, the widespread abundance of Al and Ti oxides and the localized presence of hydrophilic Zr-bearing minerals suggest that these phases, alongside hydrated clays and sulfates, play a key role in adsorbing and stabilizing water in the Martian regolith.
The ice stability models suggest that residual shallow ice deposits are scattered piecemeal across Mars in local areas depending on thermal inertia and slope of the surface, and past history, with essentially no accessible ice at latitudes 30° and lower, with occasional deposits in the 30s, and increasing frequency of local icy sites above 40° latitude, and widespread accessible ice deposits above 50° latitude. This seems to be in rough agreement with observations to date.
The Mars Odyssey Team used neutron spectroscopy from orbit to map essentially the top ~1 m of the whole planetary surface of Mars. Their observations detected hydrogen, which could be due to hydrated minerals or ground ice. Heavy concentrations of hydrogen were found poleward of +60° and -60° latitude, and in a few local regions, as low as ~ 45°. In addition, lower (but non-negligible) concentrations of hydrogen were found in various areas in the equatorial zone (± 30° latitude). The limitation of these observations was the low resolution with a pixel of about 550 km in dimension. A region 550 km x 550 km with low average hydrogen might be broadly low in hydrogen or might contain several small areas with very high hydrogen. In general, one suspects that the hydrogen at the lowest latitudes is probably mineral hydrates; yet without ground truth verification, one can only guess. Subsequently, a Russian Team carried out further studies that significantly improved the resolution of the observations (broadly 200 km x 200 km). They concentrated their observations on temperate and equatorial sites. Almost all their measurements in the equatorial region are compatible with mineral hydrates and probably likely to be so. The neutron spectra measurements are important but suffer from two limitations: (1) they don’t detect hydrogen much deeper than ~ 1 m, and (2) the limited resolution hides local areas of high hydrogen concentration.
Radar observations imply discovery of huge layers of ice buried well below the surface at Medusae Fossae Formation (MFF), located at 130–230°E and 12°S–12°N, straddling the equator. The observations indicate that a dry layer, some 300 m to 600 m thick, overlays an ice-rich layer at least 1 km thick. This suggests that substantial ice layers at depth might occur at other locations on Mars, even some equatorial locations. These putative ice deposits are unlikely to be accessible in the near term, but might be accessible in the more distant future.
Radar observations concluded that the Arcadia Planita and Utopia Planitia Regions have significant amounts of near-surface ice. However, the latitude distribution was not properly discussed, and one study found no ice at “low latitudes”. It is not clear how far South these deposits persist. In particular, does any of it occur below 40°N latitude?
Radar observations of lobate debris aprons lead to the implied ice, but the latitude dependence is murky. In particular it is not clear whether these ice deposits persist to latitudes less than 40°. The term “mid-latitudes” should be banned from the journals.
A few limited rover-based radar observations were made but these were not in locations where ice is expected to be found.
Visual observations from orbit of ice on the surface of Mars depend mainly on observations of ice ejected from recent craters. These craters formed in the last few decades, constrained by repeated orbital imaging. Crater diameters ranged from 58 m down to <1 m. 1,203 crater sites were cataloged, of which 48 sites (4%) showed ice. No trends were found in the occurrences of clusters with latitude, elevation, or impact size. It is obvious from Figure 15 that occurrence of ice is almost exclusively limited to craters at 40° latitude and above, with a very few in the high thirties. Of particular interest is one very large crater that revealed ejecta ice at 35°N latitude, indicating that rarely, near surface ice might persist below 40°N. Ice has also been detected at scarps and other sloped surface features, but typically for latitudes greater than 40°N.
Morphological studies identified many areas on Mars where remnant ice is likely to remain in the subsurface, but the depth can only be speculated, and most of these deposits are north of 40°N.
Thermal infrared studies suggest that shallow ice is widespread north of 40°N and in some places down to 35°N.
The Phoenix mission demonstrated that ice was present just below the surface at 68°N latitude. Other than that, in situ observations have not produced much further evidence.
The average water content in the near-surface regolith of Mars is thought to be in the range 2-4% wt % H2O. Presuming this background is due to mineral hydrates, the corresponding average concentration of mineral hydrates of perhaps 6-12 wt %, depending on which hydrates are prevalent. The resolution is not high enough to resolve the distribution of mineral hydrates within a pixel. At one end of the scale, the mineral hydrates could be almost uniformly distributed across a pixel at relatively low concentration 8-12 wt %. At the other end of the scale, there might be large areas without mineral hydrates, and local outcrops heavily endowed with mineral hydrates at say, 80-100 wt %. In the former case, one could exploit the water in mineral hydrates almost anywhere, but it would be required to process large amounts of regolith. In the latter case, one could only operate in certain localities but the mass of mineral hydrates processed would be up to 10 times less. We are not aware that there is any direct evidence to distinguish between these two extremes. The prospects for utilizing mineral hydrates as a source of water on Mars remain very uncertain, lacking detailed high-resolution identification of putative outcrops of high concentration of hydrates. The main advantage of hydrates is their widespread occurrence.
Two articles relating Mars water to potential landing sites were reviewed. Of special importance was Golombek, et al. [11Golombek M, Williams N, Wooster P, et al. SpaceX Starship landing sites on Mars. 52nd Lunar and Planetary Science Conference 2021. 2022; (LPI Contrib. No. 2548).] that was based on a series of workshops where key players discussed options and possibilities. They discussed requirements for slope, elevation, rock distribution, reflective and load-bearing surface, and above all, H2O availability. They referred to “mid-latitude ground-ice” which implies uncertain latitudes. They selected several potential landing sites around 39°N latitude that might (or might not) have accessible ice. It remains unclear whether 39°N is a suitable latitude for a human landing. The connection between mission requirements and landing latitude requires further study.
The “SWIM” study integrated all available relevant orbital data sets to map out the near-surface distribution of ice on Mars. They combined results from neutron spectroscopy from orbit, radar from orbit, thermal inertia mapping and geomorphology to estimate the distribution of near-surface ice at various depths across the realm of latitude ± 60° for elevations less than +1 km relative to the MOLA Datum. Algorithms were created to interpolate and extrapolate the limited positive data and inferences. However, they did not include negative data where no ice was found. They produced ice maps for ±60° latitude at depths of 0-1 m, 1-5 m, and >5 m.
The map for ice at depth 0-1 m approximately followed the findings of the neutron spectroscopy data as shown in Figure 5, with most of the H2O at latitudes greater than 50°, but some penetration of near surface H2O down to about 40° or possibly lower in the Arcadia Planita and Utopia Planita regions. The map for 1-5 m shows ice at these depths to be stable at all longitudes, for latitudes from 60°N down to 30°N, and for two limited longitudes at latitudes from 60°S down to 30°S. However, we are doubtful that there is much shallow ice at latitudes below 35°. The map for >5 m mainly mirrors the map for 1-5 m, except there is less ice at >5 m than for 1-5 m, which seems surprising.
We have the following suggestions for future publications:
[11Golombek M, Williams N, Wooster P, et al. SpaceX Starship landing sites on Mars. 52nd Lunar and Planetary Science Conference 2021. 2022; (LPI Contrib. No. 2548).] Totally eliminate the confusing and misleading phrase “mid-latitudes” and provide quantitative description of latitude ranges for all observations.
[22Viola D, McEwen AS, Dundas CM. Mid-latitude Martian ice as a target for human exploration, astrobiology, and in-situ resource utilization. First Landing Site/Exploration Zone Workshop for Human Missions to the Surface of Mars. 2015. Available from: https://www.hou.usra.edu/meetings/explorationzone2015/pdf/1011.pdf] Emphasize that part of any observed region most equatorward, and clearly specify what is known about the overburden if there is one.
[33Rapp D. Will SpaceX send humans to Mars in 2028? IgMin Res. 2024 Dec 13;2(12):969-983. IgMin ID: igmin274. doi: 10.61927/igmin274. Available from: igmin.link/p274] In reporting observations of ice on Mars, give equal weight to reporting areas without ice to reporting areas with ice.
[44Rapp D. Preparing for SpaceX mission to Mars. IgMin Res. 2025 Mar 4;3(3):123-132. IgMin ID: igmin292. doi: 10.61927/igmin292. Available from: igmin.link/p292] In reporting observations of ice or mineral hydrates, provide data on the elevation of the terrain.
[55Rapp D. Human Missions to Mars. 2nd ed. 2012; 3rd ed. 2023. Heidelberg (Germany): Springer-Praxis Books; Springer. Appendix A: Solar energy on Mars. Appendix C: Water on Mars.] In reporting longitude, use the standard -180° to +180° system.
[66Mellon MT, Jakosky BM. The distribution and behavior of Martian ground ice during past and present epochs. J Geophys Res. 1995;100:11781-11799.] Temper optimism and enthusiasm; emphasize the need for “ground truth” for inferences, especially those based on photos from orbit.
[77Chamberlain MA, Boynton WV. Modeling depth to ground ice on Mars. Lunar Planet Sci XXXV. 2004; Paper 1650.] Adopt the search for accessible H2O on Mars the as primary high priority for NASA.
[88Chamberlain MA, Boynton WV. Response of Martian ground ice to orbit-induced climate change. J Geophys Res Planets. 2007;112. doi: 10.1029/2006JE002801.] Continue to exploit existing instruments to gain more information on the distribution of H2O on Mars, but consider the opportunity that will be provided when the Starship becomes operational. With huge payloads in orbit or on the surface, and enough propellant to fly unprecedented low orbits, the Starship will offer the capability to make observations and measurements not previously thought feasible. Imagine a Starship in Mars orbit still holding 150-200 MT of propellant. It could use propulsion to remain in a ~150 km orbit for two years. Or imagine a Starship that could drop fifty 2-ton penetrators at critical areas to un-Mars craters in the search for visible ice.
Since this review is concerned with accessible H2O to support human missions to Mars, it is appropriate to briefly review the requirements for H2O for conceptual human missions to Mars [9090Rapp D. Human missions to Mars using the Starship. IgMin Res. Submitted July 2025.].
NASA previously developed the so-called “DRA-5” Mars mission concept in the era of scarce mass, prior to the emergence of the Starship [9191Drake BG. Human exploration of Mars – Design Reference Architecture 5.0 (DRA-5). NASA Report SP-2009-566. 2009.]. In that era, mission design was typically based on minimizing launch mass. If the Starship becomes functional, large amounts of mass become available to carry out much more ambitious missions. While mission designs in the past used to minimize mission mass, the advent of the Starship changes the mission philosophy to a question of how to use large amounts of mass to increase accomplishments and reduce complexity and risk?
Water is required for a human mission to Mars for life support. Water is also typically required to react with Martian CO2 to produce CH4 + O2 propellants for ascent from Mars for the return trip. Depending on the scope and design of the mission, water might be sought from indigenous Mars resources, or it might be brought partly or entirely from Earth. The Starship allows bringing water from Earth for moderate missions, but use of indigenous Mars water is necessary for large missions conceived by SpaceX.
Water for the crew for a moderate mission can be estimated for a crew of six for ~500 days on Mars, at 20 kg/CM/day to be (20 x 500 x 6) = 60,000 kg = 60 metric tons and if 90% recycling could be achieved with a reliable recycling system (a significant challenge), the net water requirement from Mars would be 6 metric tons.
Water for producing propellants is first electrolyzed, and then the hydrogen is reacted with atmospheric CO2 to produce CH4 + O2 propellants. For ascent propulsion in a moderate mission, a crew of six ascends in a small (~ 9 MT) capsule to rendezvous with a waiting Earth Return Vehicle in Mars orbit, requiring about 40 MT of CH4 + O2 propellants [55Rapp D. Human Missions to Mars. 2nd ed. 2012; 3rd ed. 2023. Heidelberg (Germany): Springer-Praxis Books; Springer. Appendix A: Solar energy on Mars. Appendix C: Water on Mars.]. It requires 18 MT of water to react with 22 MT of CO2 to produce the 40 MT of propellants required for ascent [9090Rapp D. Human missions to Mars using the Starship. IgMin Res. Submitted July 2025.].
For the much more expansive mission proposed by SpaceX, the crew of 12 requires about 120 MT of water for life support in the first phase, and since the crew returns directly from the Mars surface to Earth in Starships, the water requirement to produce ascent propellants is of the order of 1,000 MT [9090Rapp D. Human missions to Mars using the Starship. IgMin Res. Submitted July 2025.]. In this case, the mission must depend on indigenous Mars water.
Our conclusion is that for moderate water requirements (perhaps up to 100 MT), water could be brought from Earth, whereas for much larger water requirements (1,000s of MT), indigenous Mars water is required. If Mars water resources are to be exploited, they have to yield thousands of MT of water.
Golombek M, Williams N, Wooster P, et al. SpaceX Starship landing sites on Mars. 52nd Lunar and Planetary Science Conference 2021. 2022; (LPI Contrib. No. 2548).
Viola D, McEwen AS, Dundas CM. Mid-latitude Martian ice as a target for human exploration, astrobiology, and in-situ resource utilization. First Landing Site/Exploration Zone Workshop for Human Missions to the Surface of Mars. 2015. Available from: https://www.hou.usra.edu/meetings/explorationzone2015/pdf/1011.pdf
Rapp D. Will SpaceX send humans to Mars in 2028? IgMin Res. 2024 Dec 13;2(12):969-983. IgMin ID: igmin274. doi: 10.61927/igmin274. Available from: igmin.link/p274
Rapp D. Preparing for SpaceX mission to Mars. IgMin Res. 2025 Mar 4;3(3):123-132. IgMin ID: igmin292. doi: 10.61927/igmin292. Available from: igmin.link/p292
Rapp D. Human Missions to Mars. 2nd ed. 2012; 3rd ed. 2023. Heidelberg (Germany): Springer-Praxis Books; Springer. Appendix A: Solar energy on Mars. Appendix C: Water on Mars.
Mellon MT, Jakosky BM. The distribution and behavior of Martian ground ice during past and present epochs. J Geophys Res. 1995;100:11781-11799.
Chamberlain MA, Boynton WV. Modeling depth to ground ice on Mars. Lunar Planet Sci XXXV. 2004; Paper 1650.
Chamberlain MA, Boynton WV. Response of Martian ground ice to orbit-induced climate change. J Geophys Res Planets. 2007;112. doi: 10.1029/2006JE002801.
Kite ES, Tutolo BM, Turner ML, Franz HB, Burtt DG, Bristow TF, Fischer WW, Milliken RE, Fraeman AA, Zhou DY. Carbonate formation and fluctuating habitability on Mars. Nature. 2025 Jul;643(8070):60-66. doi: 10.1038/s41586-025-09161-1. Epub 2025 Jul 2. PMID: 40604181; PMCID: PMC12221984.
Skorov YV. Stability of water ice under a porous nonvolatile layer: implications to the south polar layered deposits of Mars. Planetary and Space Sci. 2001;49:59-63.
Mellon MT, Phillips RJ. Recent gullies on Mars and the source of liquid water. Abstracts of Papers Submitted to the 32nd Lunar and Planetary Science Conference. Houston (TX): Lunar and Planetary Institute; 2001. CD 32, Abstract 1182.
Schorghofer N, Aharonson O. Stability and exchange of subsurface ice on Mars. Lunar Planet Sci XXXV. 2004; Paper 1463. Schorghofer N, Aharonson O. Stability and exchange of subsurface ice on Mars. Journal of Geophysical Research. 2005;110:E05003.
Mellon M, Feldman W, Prettyman T. The presence and stability of ground ice in the southern hemisphere of Mars. Icarus. 2004 Jun;169(2):324-340. doi:10.1016/j.icarus.2003.10.022.
Vincendon M, Mustard J, Forget F, et al. Near-tropical subsurface ice on Mars. Geophysical Research Letters. 2010. doi:10.1029/2009GL041426.
Mellon MT, Sizemore HG. The history of ground ice at Jezero Crater Mars and other past, present, and future landing sites. Icarus. 2022;371:114667. doi:10.1016/j.icarus.2021.114667.
Lange L, Forget F, Vincendon M, Spiga A, Vos E, Aharonson O, Millour E, Bierjon A, Vandemeulebrouck R. A reappraisal of subtropical subsurface water ice stability on Mars. Geophysical Research Letters. 2023. doi:10.1029/2023GL105177.
Daubar IJ, Dundas CM, McEwen AS, et al. New craters on Mars: an updated catalog. JGR. 2022. doi:10.1029/2021JE007145.
Boynton WV, Feldman WC, Squyres SW, Prettyman TH, Bruckner J, Evans LG, Reedy RC, Starr R, Arnold JR, Drake DM, Englert PA, Metzger AE, Mitrofanov I, Trombka JI, D'Uston C, Wanke H, Gasnault O, Hamara DK, Janes DM, Marcialis RL, Maurice S, Mikheeva I, Taylor GJ, Tokar R, Shinohara C. Distribution of hydrogen in the near surface of Mars: evidence for subsurface ice deposits. Science. 2002 Jul 5;297(5578):81-5. doi: 10.1126/science.1073722. Epub 2002 May 30. PMID: 12040090.
Feldman WC, Prettyman TH, Maurice S, et al. Global distribution of near-surface hydrogen on Mars. J Geophys Res. 2004;109:E09006.
Karunatillake S, Wray JJ, Gasnault O, et al. Sulfates hydrating bulk soil in the Martian low and middle latitudes. Geophysical Research Letters. 2014;41(22):7987-7996. doi:10.1002/2014GL061136.
Pathare AV, Feldman WC, Prettyman TH, Maurice S. Driven by excess? Climatic implications of new global mapping of near-surface water-equivalent hydrogen on Mars. Icarus. 2018;301:97-116. doi:10.1016/j.icarus.2017.09.031.
Butcher FEG. Water ice at mid-latitudes on Mars. In: Oxford Research Encyclopedia of Planetary Science. Oxford Research Encyclopedias. Oxford University Press; 2022. ISBN 9780190647926. doi:10.1093/acrefore/9780190647926.013.239.
Mitrofanov IG, Zuber MT, Litvak ML, Boynton WV, Smith DE, Drake D, Hamara D, Kozyrev AS, Sanin AB, Shinohara C, Saunders RS, Tretyakov V. CO2 snow depth and subsurface water-ice abundance in the northern hemisphere of Mars. Science. 2003 Jun 27;300(5628):2081-4. doi: 10.1126/science.1084350. PMID: 12829779.
Wilson JT, Eke VR, Massey RJ, et al. Equatorial locations of water on Mars: improved resolution maps based on Mars Odyssey Neutron Spectrometer data. Icarus. 2018;295:148. doi:10.1016/j.icarus.2017.07.028.
Mitrofanov IG, Litvak ML, Varenikov AB, et al. Dynamic Albedo of Neutrons (DAN) experiment onboard NASA’s Mars Science Laboratory. Space Sci Rev. 2012;170:559-582.
Malakhov AV, Mitrofanov IG, Golovin DV, et al. High resolution map of water in the Martian regolith observed by FREND neutron telescope onboard ExoMars TGO. Journal of Geophysical Research: Planets. 2022;127(5):e2022JE007258. doi:10.1029/2022JE007258.
Mitrofanov A, Malakhov A, Djachkova M, et al. The evidence for unusually high hydrogen abundances in the central part of Valles Marineris on Mars. Icarus. 2022;374. doi:10.1016/j.icarus.2021.114805.
Jakosky BM, Mellon MT, Varnes ES, Feldman WC, Boynton WV, Haberle RM. Mars low-latitude neutron distribution: possible remnant near-surface water ice and a mechanism for its recent emplacement. Icarus. 2005;175:58-67. Erratum in: Icarus. 2005;178:291-293.
Putzig NE, Mellon MT, Kretke KA, Arvidson RE. Global thermal inertia and surface properties of Mars from the MGS mapping mission. Icarus. 2005 Feb;173(2):325-341. doi:10.1016/j.icarus.2004.08.017.
Zheng L. Water ice resources on the shallow subsurface of Mars: indications to rover-mounted radar observation. Remote Sensing (MDPI). 2024;16(5):824. Available from: https://www.mdpi.com/2072-4292/16/5/824.
Virkki AK, Neish CD, Rivera-Valentín EG, et al. Planetary radar—state-of-the-art review. Remote Sensing (MDPI). 2023;15(23):5605. Available from: https://www.mdpi.com/2072-4292/15/23/5605.
Watters TR, Campbell BA, Leuschen CJ, et al. Evidence of ice-rich layered deposits in the Medusae Fossae Formation of Mars. Geophysical Research Letters. 2023. doi:10.1029/2023GL105490.
Fastook JL, Head JW. Origin of ice in the Medusae Fossae Formation, equatorial Mars. Icarus. 2024;421:116226. doi:10.1016/j.icarus.2024.116226.
European Space Agency (ESA). Buried ice at the equator. 2024. Press release. Available from: https://www.esa.int/Science_Exploration/Space_Science/Mars_Express/Buried_water_ice_at_Mars_s_equator.
Putzig N, Brothers TC, Sutton S. Widespread excess ice in Arcadia Planitia, Mars. Geophysical Research Letters. 2015. doi:10.1002/2015GL064844.
Bramson AM, Byrne S, Putzig NE, et al. Widespread excess ice in Arcadia Planitia, Mars. Geophysical Research Letters. 2015 Aug 26. doi:10.1002/2015GL064844.
Bramson AM, Byrne S, Bapst J. Preservation of midlatitude ice sheets on Mars. Journal of Geophysical Research: Planets. 2017;122:2250-2266. doi:10.1002/2017JE005357.
Gou S, Yue Z, Di K, et al. Subsurface stratigraphy suggested by the layered ejecta craters in the Martian northern planitiae. Icarus. 2024;416:116100. doi:10.1016/j.icarus.2024.116100.
Stuurman CM, Osinski GR, Holt JW, et al. SHARAD detection and characterization of subsurface water ice deposits in Utopia Planitia, Mars. Geophysical Research Letters. 2016;43(18):9484-9491. doi:10.1002/2016GL070138.
Hibbard SM, Williams NR, Golombek MP, Osinski GR, Godin E. Evidence for widespread glaciation in Arcadia Planitia, Mars. Icarus. 2021;359:114298. doi:10.1016/j.icarus.2020.114298.
Wang Y, Feng X, Zhou H, et al. Water ice detection research in Utopia Planitia based on simulation of Mars rover full-polarimetric subsurface penetrating radar. Remote Sensing (MDPI). 2022. Special issue: Advanced Ground Penetrating Radar Theory and Applications.
Ma Y, Xiao Z, Luo F, et al. SHARAD observations for layered ejecta deposits formed by late-Amazonian-aged impact craters at low latitudes of Mars. Icarus. 2023;404:115689. doi:10.1016/j.icarus.2023.115689.
Plaut JJ, Safaeinili A, Holt JW, Phillips RJ, Head JW, Seu R, Putzig NE, Frigeri A. Radar evidence for ice in lobate debris aprons in the mid-northern latitudes of Mars. Geophys Res Lett. 2009;36:L02203. doi:10.1029/2008GL036379.
Petersen EI, Holt JW, Levy JS. High ice purity of Martian lobate debris aprons at the regional scale: evidence from an orbital radar sounding survey in Deuteronilus and Protonilus Mensae. Geophys Res Lett. 2018;45(21):11595-11604. doi:10.1029/2018GL079759.
Chuang FC, Crown DA, Berman DC, Joseph ECS. Mapping lobate debris aprons and related ice-rich flow features in the Southern Hemisphere of Mars. 44th Lunar and Planetary Science Conference. 2013.
Sinha RK, Ray D. Extensive glaciation in the Erebus Montes region of Mars. Icarus. 2021;367:114557. doi:10.1016/j.icarus.2021.114557.
Baker DMH, Head JW. Extensive Middle Amazonian mantling of debris aprons and plains in Deuteronilus Mensae, Mars: implications for the record of mid-latitude glaciation. Icarus. 2015;260:269-288. Available from: https://citeseerx.ist.psu.edu/document?repid=rep1&type=pdf&doi=14f39b8bcd6c88f7460dcf9bf9d04ea2b2cac803
Hauber E, van Gasselt S, Chapman MG, Neukum G. Geomorphic evidence for former lobate debris aprons at low latitudes on Mars: indicators of the Martian paleoclimate. JGR Planets. 2008 Feb 21. doi:10.1029/2007JE002897.
Steinberg Y, Smith IB, Aharonson O. Physical properties of subsurface water ice deposits in Mars’s mid-latitudes from the Shallow Radar. Icarus. 2025;441:116716.
Hamran S-E, Paige DA, Amundsen HEF. Radar Imager for Mars’ Subsurface Experiment (RIMFAX). Space Sci Rev. 2020;216:128. doi:10.1007/s11214-020-00740-4.
Hamran SE, Paige DA, Allwood A, Amundsen HEF, Berger T, Brovoll S, Carter L, Casademont TM, Damsgård L, Dypvik H, Eide S, Fairén AG, Ghent R, Kohler J, Mellon MT, Nunes DC, Plettemeier D, Russell P, Siegler M, Øyan MJ. Ground penetrating radar observations of subsurface structures in the floor of Jezero crater, Mars. Sci Adv. 2022 Aug 26;8(34):eabp8564. doi: 10.1126/sciadv.abp8564. Epub 2022 Aug 25. PMID: 36007008; PMCID: PMC9410267.
Paige D, Hamran S-E, Amundsen HEF, Berger T. Ground penetrating radar observations of the contact between the western delta and the crater floor of Jezero Crater, Mars. Science Advances. 2024 Jan 26;10(4). doi:10.1126/sciadv.adi8339.
Zhou B, Shen S, Lu W, Liu Q, Tang C, Li S, Fang G. The Mars rover subsurface penetrating radar onboard China’s Mars 2020 mission. Earth Planet Phys. 2020;4:345-354.
Li C, Zheng Y, Wang X, Zhang J, Wang Y, Chen L, Zhang L, Zhao P, Liu Y, Lv W, Liu Y, Zhao X, Hao J, Sun W, Liu X, Jia B, Li J, Lan H, Fa W, Pan Y, Wu F. Layered subsurface in Utopia Basin of Mars revealed by Zhurong rover radar. Nature. 2022 Oct;610(7931):308-312. doi: 10.1038/s41586-022-05147-5. Epub 2022 Sep 26. Erratum in: Nature. 2023 Feb;614(7947):E30. doi: 10.1038/s41586-023-05734-0. PMID: 36163288; PMCID: PMC9556330.
Dundas CM, Mellon MT, Conway SJ, et al. Widespread exposures of extensive clean shallow ice in the midlatitudes of Mars. Journal of Geophysical Research: Planets. 2021;126(3). doi:10.1029/2020JE006617.
Dundas CM, Mellon MT, Posiolova LV, et al. A large new crater exposes the limits of water ice on Mars. Geophysical Research Letters. 2023;50(2). doi:10.1029/2022GL100747.
Posiolova LV, Lognonné P, Banerdt WB, Clinton J, Collins GS, Kawamura T, Ceylan S, Daubar IJ, Fernando B, Froment M, Giardini D, Malin MC, Miljković K, Stähler SC, Xu Z, Banks ME, Beucler É, Cantor BA, Charalambous C, Dahmen N, Davis P, Drilleau M, Dundas CM, Durán C, Euchner F, Garcia RF, Golombek M, Horleston A, Keegan C, Khan A, Kim D, Larmat C, Lorenz R, Margerin L, Menina S, Panning M, Pardo C, Perrin C, Pike WT, Plasman M, Rajšić A, Rolland L, Rougier E, Speth G, Spiga A, Stott A, Susko D, Teanby NA, Valeh A, Werynski A, Wójcicka N, Zenhäusern G. Largest recent impact craters on Mars: Orbital imaging and surface seismic co-investigation. Science. 2022 Oct 28;378(6618):412-417. doi: 10.1126/science.abq7704. Epub 2022 Oct 27. PMID: 36302013.
Viola D, McEwen AS, Dundas CM, Byrne S. Expanded secondary craters in the Arcadia Planitia region, Mars: evidence for tens of Myr-old shallow subsurface ice. Icarus. 2015;248:190–204.
Vincendon M, Forget F, Mustard J. Water ice at low to midlatitudes on Mars. Journal of Geophysical Research. 2010;115:E10001. doi:10.1029/2010JE003584.
Piqueux S, Buz J, Edwards CS, et al. Widespread shallow water ice on Mars at high latitudes and midlatitudes. Geophysical Research Letters. 2019;46. doi:10.1029/2019GL083947.
Mangold N, Maurice S, Feldman WC, Costard F, Forget F. Spatial relationships between patterned ground and ground ice detected by the Neutron Spectrometer on Mars. JGR Planets. 2004. doi:10.1029/2004JE002235.
Morgan GA, Putzig NE, Baker DMH, et al. Refined mapping of subsurface water ice on Mars to support future missions. The Planetary Science Journal. 2025;6:29. doi:10.3847/PSJ/ad9b24.
Gourronc M, Bourgeois O, Mège D, et al. One million cubic kilometers of fossil ice in Valles Marineris: relicts of a 3.5 Gy old glacial land system along the Martian equator. Geomorphology. 2014;204:235–255. doi:10.1016/j.geomorph.2013.08.009.
Khuller AR, Christensen PR. Evidence of exposed dusty water ice within Martian gullies. JGR Planets. 2021;126(2):e2020JE006539. doi:10.1029/2020JE006539.
Shean DE. Candidate ice-rich material within equatorial craters on Mars. Geophysical Research Letters. 2010. doi:10.1029/2010GL045181.
Science Magazine. Phoenix touches Martian ice. 2008. Available from: https://www.science.org/content/article/phoenix-touches-martian-ice
Ehlmann BL, Edwards CS. Mineralogy of the Martian surface. Annual Review of Earth and Planetary Sciences. 2014;42:291–315. doi:10.1146/annurev-earth-060313-055024.
Audouard J, Poulet F, Vincendon M, et al. Water in the Martian regolith from OMEGA/Mars Express. Journal of Geophysical Research: Planets. 2014;119(8):1969–1989. doi:10.1002/2014JE004649.
Gross C, Al-Samir M, Bishop JL, Poulet F, Postberg F, Schubert D. Prospecting in-situ resources for future crewed missions to Mars. Acta Astronautica. 2024;223:15–24. doi:10.1016/j.actaastro.2024.07.003.
Riu L, Carter J, Poulet F, Cardesín-Moinelo A, Martin P. Global surficial water content stored in hydrated silicates at Mars from OMEGA/MEx. Icarus. 2023;398:115537. doi:10.1016/j.icarus.2023.115537.
Mustard JF, Murchie SL, Pelkey SM, Ehlmann BL, Milliken RE, Grant JA, Bibring JP, Poulet F, Bishop J, Dobrea EN, Roach L, Seelos F, Arvidson RE, Wiseman S, Green R, Hash C, Humm D, Malaret E, McGovern JA, Seelos K, Clancy T, Clark R, Marais DD, Izenberg N, Knudson A, Langevin Y, Martin T, McGuire P, Morris R, Robinson M, Roush T, Smith M, Swayze G, Taylor H, Titus T, Wolff M. Hydrated silicate minerals on Mars observed by the Mars Reconnaissance Orbiter CRISM instrument. Nature. 2008 Jul 17;454(7202):305-9. doi: 10.1038/nature07097. Epub 2008 Jul 16. PMID: 18633411.
Wernicke LJ, Jakosky BM. Martian hydrated minerals: a significant water sink. JGR Planets. 2021;126(3):e2019JE006351. doi:10.1029/2019JE006351.
Mustard JF. Sequestration of volatiles in the Martian crust through hydrated minerals. In: Volatiles in the Martian Crust. Elsevier; 2019. p. 247–263. doi:10.1016/B978-0-12-804191-8.00008-8.
Siljeström S, Czaja AD, Corpolongo A, et al. Evidence of sulfate-rich fluid alteration in Jezero Crater floor, Mars. JGR Planets. 2024;129(1):e2023JE007989. doi:10.1029/2023JE007989.
Karunatillake S, Wray JJ, Gasnault O, et al. Sulfates hydrating bulk soil in the Martian low and middle latitudes. Geophysical Research Letters. 2014;41(22):7987–7996. doi:10.1002/2014GL061136.
Vaniman D, Chipera S, Rampe E, et al. Gypsum on Mars: a detailed view at Gale Crater. Minerals. 2024;14(8):815. doi:10.3390/min14080815.
Clark BC, Morris RV, McLennan SM. Chemistry and mineralogy of outcrops at Meridiani Planum. Earth Planet Sci Lett. 2005;240(1):73–94. doi:10.1016/j.epsl.2005.09.040.
Ralphs M, Franz B, Baker T, Howe S. Water extraction on Mars for an expanding human colony. Life Sci Space Res (Amst). 2015 Nov;7:57-60. doi: 10.1016/j.lssr.2015.10.001. Epub 2015 Oct 22. PMID: 26553638.
Carter J, Poulet F, Bibring J-P, Mangold N, Murchie S. Hydrous minerals on Mars as seen by the CRISM and OMEGA imaging spectrometers: updated global view. JGR Planets. 2013;118:831–858. doi:10.1029/2012JE004145.
Murchie SL, Ehlmann BL, Arvidson RE. Geological water resources for humans on Mars: constraints from orbital spectral mapping and in situ measurements. Lunar Planet Sci. 2016;47:abstract #1261.
Murchie SL, Arvidson RE, Bishop JL, et al. Maximizing the science and resource mapping potential of orbital VSWIR spectral measurements of Mars. Planetary Science and Astrobiology Decadal Survey 2023-2032 white paper. Bull Am Astron Soc. 2021;53(4):e-id. 119.
Golombek M, Rapp D. Size-frequency distributions of rocks on Mars and Earth analog sites: implications for future landed missions. JGR. 1997;102:4117–4129.
Golombek M, Huertas A, Kipp D, Calef F. Rock abundance maps of the final four Mars Science Laboratory landing sites. Mars J. 2012;7:1–22. doi:10.1555/mars.2012.0001.
Inglevakis V. Martian Aqua: occurrence of water and appraisal of acquisition technologies. Manuscript under preparation. 2025.
Martínez GM, Newman CN, De Vicente-Retortillo A, et al. The modern near-surface Martian climate: a review of in-situ meteorological data from Viking to Curiosity. Space Sci Rev. 2017;212(1–2):295–338. doi:10.1007/s11214-017-0360-x.
Tamppari LK, Lemmon MT. Near-surface atmospheric water vapor enhancement at the Mars Phoenix lander site. Icarus. 2020;343:113624. doi:10.1016/j.icarus.2020.113624.
Titov DV. Water vapour in the atmosphere of Mars. Adv Space Res. 2002;29(2):183–191. doi:10.1016/S0273-1177(01)00568-3.
Titov DV, Markiewicz WJ, Thomas N, Keller HU, Sablotny RM, Tomasko MG, Lemmon MT, Smith PH. Measurements of the atmospheric water vapor on Mars by the Imager for Mars Pathfinder. JGR Planets. 1999;104(E4):9019–9026. doi:10.1029/1998JE900046.
Knutsen EW, Montmessin F, Verdier L, et al. Water vapor on Mars: a refined climatology and constraints on the near-surface concentration enabled by synergistic retrievals. JGR Planets. 2022;127(5). doi:10.1029/2022JE007252.
Rapp D. Human missions to Mars using the Starship. IgMin Res. Submitted July 2025.
Drake BG. Human exploration of Mars – Design Reference Architecture 5.0 (DRA-5). NASA Report SP-2009-566. 2009.
Bussey B, Hoffman SJ. Human Mars landing site and impacts on Mars surface operations. 2016 IEEE Aerospace Conference. 2016. doi:10.1109/AERO.2016.7500775. Available from: https://ntrs.nasa.gov/api/citations/20160001040/downloads/20160001040.pdf
Ming DW, Morris RV. Chemical, mineralogical, and physical properties of Martian dust and soil. Meeting: Dust in the Atmosphere of Mars and Its Impact on Human Exploration Workshop, Houston, TX, June 13–15, 2017.
Benkoula S, Sublemontier O, Patanen M, Nicolas C, Sirotti F, Naitabdi A, Gaie-Levrel F, Antonsson E, Aureau D, Ouf FX, Wada S, Etcheberry A, Ueda K, Miron C. Water adsorption on TiO2 surfaces probed by soft X-ray spectroscopies: bulk materials vs. isolated nanoparticles. Sci Rep. 2015 Oct 14;5:15088. doi: 10.1038/srep15088. PMID: 26462615; PMCID: PMC4604456.
Cannon KM. Mineral resources of Mars based on decades of sample analysis. Space and Planetary Resources. 2025;1:1. Available from: https://doi.org/10.1007/s44461-025-00001-8
Rapp D, Inglezakis V. Accessible H2O on Mars – A Critical Review of Current Knowledge. IgMin Res. November 25, 2025; 3(11): 407-439. IgMin ID: igmin322; DOI:10.61927/igmin322; Available at: igmin.link/p322
1Independent Researcher, 1445 Indiana Avenue, South Pasadena, CA 91030, USA
2Department of Chemical & Process Engineering, University of Strathclyde, 75 Montrose Street, Glasgow G1 1XJ, UK
Address Correspondence: Donald Rapp, Independent Researcher, 1445 Indiana Avenue, South Pasadena, CA 91030, USA, Email: drdrapp@earthlink.net
How to cite this article: Rapp D, Inglezakis V. Accessible H2O on Mars – A Critical Review of Current Knowledge. IgMin Res. November 25, 2025; 3(11): 407-439. IgMin ID: igmin322; DOI:10.61927/igmin322; Available at: igmin.link/p322
Copyright: 2025 Rapp D, et al. This is an open access article distributed under the Creative Commons Attribution License, which permits unrestricted use, distribution, and reproduction in any medium, provided the original work is properly cited.
Figure 1: Comparison of insolation on a horizontal surface s...
Figure 2: Minimum depth to stability of ground ice vs. latit...
Figure 3: Approximate interpretation Figure 10 of Chamberlai...
Figure 5: Global variation of water content in upper ~ 1 m o...
Figure 6: Simplified version of updated plot of Mars Odyssey...
Figure 7: Water equivalent hydrogen maps, measured by collim...
Figure 8: Enhanced segments of the global map shown in Figur...
Figure 9: Comparison of the Arabia Terra segment of the WEH ...
Figure 10: Minimum (a) and maximum (b) Water Equivalent Hydro...
Figure 11: The small (purple) region with observed 40.3% WEH....
Figure 12: Water equivalent hydrogen map, measured by collima...
Figure 13: Water equivalent hydrogen map, measured by collima...
Figure 14: Regions explored by Steinberg, et al. [49]. The re...
Figure 15: Locations of 1,203 craters, showing which were dry...
Figure 16: Large crater at 35.1°N, 189.8°E consistent with ...
Figure 17: Near-surface ice revealed by digging on the Phoeni...
Figure 18: Global map of hydrous mineral detections on Mars. ...
Figure 19: Comparison of hydrous mineral exposures to very du...
Figure 4: Fraction of a year for which frost point is higher...
Table 1: Review of layered ejecta craters (LECs) at the Pla...
Table 2: Summary of Data and Observations....
Golombek M, Williams N, Wooster P, et al. SpaceX Starship landing sites on Mars. 52nd Lunar and Planetary Science Conference 2021. 2022; (LPI Contrib. No. 2548).
Viola D, McEwen AS, Dundas CM. Mid-latitude Martian ice as a target for human exploration, astrobiology, and in-situ resource utilization. First Landing Site/Exploration Zone Workshop for Human Missions to the Surface of Mars. 2015. Available from: https://www.hou.usra.edu/meetings/explorationzone2015/pdf/1011.pdf
Rapp D. Will SpaceX send humans to Mars in 2028? IgMin Res. 2024 Dec 13;2(12):969-983. IgMin ID: igmin274. doi: 10.61927/igmin274. Available from: igmin.link/p274
Rapp D. Preparing for SpaceX mission to Mars. IgMin Res. 2025 Mar 4;3(3):123-132. IgMin ID: igmin292. doi: 10.61927/igmin292. Available from: igmin.link/p292
Rapp D. Human Missions to Mars. 2nd ed. 2012; 3rd ed. 2023. Heidelberg (Germany): Springer-Praxis Books; Springer. Appendix A: Solar energy on Mars. Appendix C: Water on Mars.
Mellon MT, Jakosky BM. The distribution and behavior of Martian ground ice during past and present epochs. J Geophys Res. 1995;100:11781-11799.
Chamberlain MA, Boynton WV. Modeling depth to ground ice on Mars. Lunar Planet Sci XXXV. 2004; Paper 1650.
Chamberlain MA, Boynton WV. Response of Martian ground ice to orbit-induced climate change. J Geophys Res Planets. 2007;112. doi: 10.1029/2006JE002801.
Kite ES, Tutolo BM, Turner ML, Franz HB, Burtt DG, Bristow TF, Fischer WW, Milliken RE, Fraeman AA, Zhou DY. Carbonate formation and fluctuating habitability on Mars. Nature. 2025 Jul;643(8070):60-66. doi: 10.1038/s41586-025-09161-1. Epub 2025 Jul 2. PMID: 40604181; PMCID: PMC12221984.
Skorov YV. Stability of water ice under a porous nonvolatile layer: implications to the south polar layered deposits of Mars. Planetary and Space Sci. 2001;49:59-63.
Mellon MT, Phillips RJ. Recent gullies on Mars and the source of liquid water. Abstracts of Papers Submitted to the 32nd Lunar and Planetary Science Conference. Houston (TX): Lunar and Planetary Institute; 2001. CD 32, Abstract 1182.
Schorghofer N, Aharonson O. Stability and exchange of subsurface ice on Mars. Lunar Planet Sci XXXV. 2004; Paper 1463. Schorghofer N, Aharonson O. Stability and exchange of subsurface ice on Mars. Journal of Geophysical Research. 2005;110:E05003.
Mellon M, Feldman W, Prettyman T. The presence and stability of ground ice in the southern hemisphere of Mars. Icarus. 2004 Jun;169(2):324-340. doi:10.1016/j.icarus.2003.10.022.
Vincendon M, Mustard J, Forget F, et al. Near-tropical subsurface ice on Mars. Geophysical Research Letters. 2010. doi:10.1029/2009GL041426.
Mellon MT, Sizemore HG. The history of ground ice at Jezero Crater Mars and other past, present, and future landing sites. Icarus. 2022;371:114667. doi:10.1016/j.icarus.2021.114667.
Lange L, Forget F, Vincendon M, Spiga A, Vos E, Aharonson O, Millour E, Bierjon A, Vandemeulebrouck R. A reappraisal of subtropical subsurface water ice stability on Mars. Geophysical Research Letters. 2023. doi:10.1029/2023GL105177.
Daubar IJ, Dundas CM, McEwen AS, et al. New craters on Mars: an updated catalog. JGR. 2022. doi:10.1029/2021JE007145.
Boynton WV, Feldman WC, Squyres SW, Prettyman TH, Bruckner J, Evans LG, Reedy RC, Starr R, Arnold JR, Drake DM, Englert PA, Metzger AE, Mitrofanov I, Trombka JI, D'Uston C, Wanke H, Gasnault O, Hamara DK, Janes DM, Marcialis RL, Maurice S, Mikheeva I, Taylor GJ, Tokar R, Shinohara C. Distribution of hydrogen in the near surface of Mars: evidence for subsurface ice deposits. Science. 2002 Jul 5;297(5578):81-5. doi: 10.1126/science.1073722. Epub 2002 May 30. PMID: 12040090.
Feldman WC, Prettyman TH, Maurice S, et al. Global distribution of near-surface hydrogen on Mars. J Geophys Res. 2004;109:E09006.
Karunatillake S, Wray JJ, Gasnault O, et al. Sulfates hydrating bulk soil in the Martian low and middle latitudes. Geophysical Research Letters. 2014;41(22):7987-7996. doi:10.1002/2014GL061136.
Pathare AV, Feldman WC, Prettyman TH, Maurice S. Driven by excess? Climatic implications of new global mapping of near-surface water-equivalent hydrogen on Mars. Icarus. 2018;301:97-116. doi:10.1016/j.icarus.2017.09.031.
Butcher FEG. Water ice at mid-latitudes on Mars. In: Oxford Research Encyclopedia of Planetary Science. Oxford Research Encyclopedias. Oxford University Press; 2022. ISBN 9780190647926. doi:10.1093/acrefore/9780190647926.013.239.
Mitrofanov IG, Zuber MT, Litvak ML, Boynton WV, Smith DE, Drake D, Hamara D, Kozyrev AS, Sanin AB, Shinohara C, Saunders RS, Tretyakov V. CO2 snow depth and subsurface water-ice abundance in the northern hemisphere of Mars. Science. 2003 Jun 27;300(5628):2081-4. doi: 10.1126/science.1084350. PMID: 12829779.
Wilson JT, Eke VR, Massey RJ, et al. Equatorial locations of water on Mars: improved resolution maps based on Mars Odyssey Neutron Spectrometer data. Icarus. 2018;295:148. doi:10.1016/j.icarus.2017.07.028.
Mitrofanov IG, Litvak ML, Varenikov AB, et al. Dynamic Albedo of Neutrons (DAN) experiment onboard NASA’s Mars Science Laboratory. Space Sci Rev. 2012;170:559-582.
Malakhov AV, Mitrofanov IG, Golovin DV, et al. High resolution map of water in the Martian regolith observed by FREND neutron telescope onboard ExoMars TGO. Journal of Geophysical Research: Planets. 2022;127(5):e2022JE007258. doi:10.1029/2022JE007258.
Mitrofanov A, Malakhov A, Djachkova M, et al. The evidence for unusually high hydrogen abundances in the central part of Valles Marineris on Mars. Icarus. 2022;374. doi:10.1016/j.icarus.2021.114805.
Jakosky BM, Mellon MT, Varnes ES, Feldman WC, Boynton WV, Haberle RM. Mars low-latitude neutron distribution: possible remnant near-surface water ice and a mechanism for its recent emplacement. Icarus. 2005;175:58-67. Erratum in: Icarus. 2005;178:291-293.
Putzig NE, Mellon MT, Kretke KA, Arvidson RE. Global thermal inertia and surface properties of Mars from the MGS mapping mission. Icarus. 2005 Feb;173(2):325-341. doi:10.1016/j.icarus.2004.08.017.
Zheng L. Water ice resources on the shallow subsurface of Mars: indications to rover-mounted radar observation. Remote Sensing (MDPI). 2024;16(5):824. Available from: https://www.mdpi.com/2072-4292/16/5/824.
Virkki AK, Neish CD, Rivera-Valentín EG, et al. Planetary radar—state-of-the-art review. Remote Sensing (MDPI). 2023;15(23):5605. Available from: https://www.mdpi.com/2072-4292/15/23/5605.
Watters TR, Campbell BA, Leuschen CJ, et al. Evidence of ice-rich layered deposits in the Medusae Fossae Formation of Mars. Geophysical Research Letters. 2023. doi:10.1029/2023GL105490.
Fastook JL, Head JW. Origin of ice in the Medusae Fossae Formation, equatorial Mars. Icarus. 2024;421:116226. doi:10.1016/j.icarus.2024.116226.
European Space Agency (ESA). Buried ice at the equator. 2024. Press release. Available from: https://www.esa.int/Science_Exploration/Space_Science/Mars_Express/Buried_water_ice_at_Mars_s_equator.
Putzig N, Brothers TC, Sutton S. Widespread excess ice in Arcadia Planitia, Mars. Geophysical Research Letters. 2015. doi:10.1002/2015GL064844.
Bramson AM, Byrne S, Putzig NE, et al. Widespread excess ice in Arcadia Planitia, Mars. Geophysical Research Letters. 2015 Aug 26. doi:10.1002/2015GL064844.
Bramson AM, Byrne S, Bapst J. Preservation of midlatitude ice sheets on Mars. Journal of Geophysical Research: Planets. 2017;122:2250-2266. doi:10.1002/2017JE005357.
Gou S, Yue Z, Di K, et al. Subsurface stratigraphy suggested by the layered ejecta craters in the Martian northern planitiae. Icarus. 2024;416:116100. doi:10.1016/j.icarus.2024.116100.
Stuurman CM, Osinski GR, Holt JW, et al. SHARAD detection and characterization of subsurface water ice deposits in Utopia Planitia, Mars. Geophysical Research Letters. 2016;43(18):9484-9491. doi:10.1002/2016GL070138.
Hibbard SM, Williams NR, Golombek MP, Osinski GR, Godin E. Evidence for widespread glaciation in Arcadia Planitia, Mars. Icarus. 2021;359:114298. doi:10.1016/j.icarus.2020.114298.
Wang Y, Feng X, Zhou H, et al. Water ice detection research in Utopia Planitia based on simulation of Mars rover full-polarimetric subsurface penetrating radar. Remote Sensing (MDPI). 2022. Special issue: Advanced Ground Penetrating Radar Theory and Applications.
Ma Y, Xiao Z, Luo F, et al. SHARAD observations for layered ejecta deposits formed by late-Amazonian-aged impact craters at low latitudes of Mars. Icarus. 2023;404:115689. doi:10.1016/j.icarus.2023.115689.
Plaut JJ, Safaeinili A, Holt JW, Phillips RJ, Head JW, Seu R, Putzig NE, Frigeri A. Radar evidence for ice in lobate debris aprons in the mid-northern latitudes of Mars. Geophys Res Lett. 2009;36:L02203. doi:10.1029/2008GL036379.
Petersen EI, Holt JW, Levy JS. High ice purity of Martian lobate debris aprons at the regional scale: evidence from an orbital radar sounding survey in Deuteronilus and Protonilus Mensae. Geophys Res Lett. 2018;45(21):11595-11604. doi:10.1029/2018GL079759.
Chuang FC, Crown DA, Berman DC, Joseph ECS. Mapping lobate debris aprons and related ice-rich flow features in the Southern Hemisphere of Mars. 44th Lunar and Planetary Science Conference. 2013.
Sinha RK, Ray D. Extensive glaciation in the Erebus Montes region of Mars. Icarus. 2021;367:114557. doi:10.1016/j.icarus.2021.114557.
Baker DMH, Head JW. Extensive Middle Amazonian mantling of debris aprons and plains in Deuteronilus Mensae, Mars: implications for the record of mid-latitude glaciation. Icarus. 2015;260:269-288. Available from: https://citeseerx.ist.psu.edu/document?repid=rep1&type=pdf&doi=14f39b8bcd6c88f7460dcf9bf9d04ea2b2cac803
Hauber E, van Gasselt S, Chapman MG, Neukum G. Geomorphic evidence for former lobate debris aprons at low latitudes on Mars: indicators of the Martian paleoclimate. JGR Planets. 2008 Feb 21. doi:10.1029/2007JE002897.
Steinberg Y, Smith IB, Aharonson O. Physical properties of subsurface water ice deposits in Mars’s mid-latitudes from the Shallow Radar. Icarus. 2025;441:116716.
Hamran S-E, Paige DA, Amundsen HEF. Radar Imager for Mars’ Subsurface Experiment (RIMFAX). Space Sci Rev. 2020;216:128. doi:10.1007/s11214-020-00740-4.
Hamran SE, Paige DA, Allwood A, Amundsen HEF, Berger T, Brovoll S, Carter L, Casademont TM, Damsgård L, Dypvik H, Eide S, Fairén AG, Ghent R, Kohler J, Mellon MT, Nunes DC, Plettemeier D, Russell P, Siegler M, Øyan MJ. Ground penetrating radar observations of subsurface structures in the floor of Jezero crater, Mars. Sci Adv. 2022 Aug 26;8(34):eabp8564. doi: 10.1126/sciadv.abp8564. Epub 2022 Aug 25. PMID: 36007008; PMCID: PMC9410267.
Paige D, Hamran S-E, Amundsen HEF, Berger T. Ground penetrating radar observations of the contact between the western delta and the crater floor of Jezero Crater, Mars. Science Advances. 2024 Jan 26;10(4). doi:10.1126/sciadv.adi8339.
Zhou B, Shen S, Lu W, Liu Q, Tang C, Li S, Fang G. The Mars rover subsurface penetrating radar onboard China’s Mars 2020 mission. Earth Planet Phys. 2020;4:345-354.
Li C, Zheng Y, Wang X, Zhang J, Wang Y, Chen L, Zhang L, Zhao P, Liu Y, Lv W, Liu Y, Zhao X, Hao J, Sun W, Liu X, Jia B, Li J, Lan H, Fa W, Pan Y, Wu F. Layered subsurface in Utopia Basin of Mars revealed by Zhurong rover radar. Nature. 2022 Oct;610(7931):308-312. doi: 10.1038/s41586-022-05147-5. Epub 2022 Sep 26. Erratum in: Nature. 2023 Feb;614(7947):E30. doi: 10.1038/s41586-023-05734-0. PMID: 36163288; PMCID: PMC9556330.
Dundas CM, Mellon MT, Conway SJ, et al. Widespread exposures of extensive clean shallow ice in the midlatitudes of Mars. Journal of Geophysical Research: Planets. 2021;126(3). doi:10.1029/2020JE006617.
Dundas CM, Mellon MT, Posiolova LV, et al. A large new crater exposes the limits of water ice on Mars. Geophysical Research Letters. 2023;50(2). doi:10.1029/2022GL100747.
Posiolova LV, Lognonné P, Banerdt WB, Clinton J, Collins GS, Kawamura T, Ceylan S, Daubar IJ, Fernando B, Froment M, Giardini D, Malin MC, Miljković K, Stähler SC, Xu Z, Banks ME, Beucler É, Cantor BA, Charalambous C, Dahmen N, Davis P, Drilleau M, Dundas CM, Durán C, Euchner F, Garcia RF, Golombek M, Horleston A, Keegan C, Khan A, Kim D, Larmat C, Lorenz R, Margerin L, Menina S, Panning M, Pardo C, Perrin C, Pike WT, Plasman M, Rajšić A, Rolland L, Rougier E, Speth G, Spiga A, Stott A, Susko D, Teanby NA, Valeh A, Werynski A, Wójcicka N, Zenhäusern G. Largest recent impact craters on Mars: Orbital imaging and surface seismic co-investigation. Science. 2022 Oct 28;378(6618):412-417. doi: 10.1126/science.abq7704. Epub 2022 Oct 27. PMID: 36302013.
Viola D, McEwen AS, Dundas CM, Byrne S. Expanded secondary craters in the Arcadia Planitia region, Mars: evidence for tens of Myr-old shallow subsurface ice. Icarus. 2015;248:190–204.
Vincendon M, Forget F, Mustard J. Water ice at low to midlatitudes on Mars. Journal of Geophysical Research. 2010;115:E10001. doi:10.1029/2010JE003584.
Piqueux S, Buz J, Edwards CS, et al. Widespread shallow water ice on Mars at high latitudes and midlatitudes. Geophysical Research Letters. 2019;46. doi:10.1029/2019GL083947.
Mangold N, Maurice S, Feldman WC, Costard F, Forget F. Spatial relationships between patterned ground and ground ice detected by the Neutron Spectrometer on Mars. JGR Planets. 2004. doi:10.1029/2004JE002235.
Morgan GA, Putzig NE, Baker DMH, et al. Refined mapping of subsurface water ice on Mars to support future missions. The Planetary Science Journal. 2025;6:29. doi:10.3847/PSJ/ad9b24.
Gourronc M, Bourgeois O, Mège D, et al. One million cubic kilometers of fossil ice in Valles Marineris: relicts of a 3.5 Gy old glacial land system along the Martian equator. Geomorphology. 2014;204:235–255. doi:10.1016/j.geomorph.2013.08.009.
Khuller AR, Christensen PR. Evidence of exposed dusty water ice within Martian gullies. JGR Planets. 2021;126(2):e2020JE006539. doi:10.1029/2020JE006539.
Shean DE. Candidate ice-rich material within equatorial craters on Mars. Geophysical Research Letters. 2010. doi:10.1029/2010GL045181.
Science Magazine. Phoenix touches Martian ice. 2008. Available from: https://www.science.org/content/article/phoenix-touches-martian-ice
Ehlmann BL, Edwards CS. Mineralogy of the Martian surface. Annual Review of Earth and Planetary Sciences. 2014;42:291–315. doi:10.1146/annurev-earth-060313-055024.
Audouard J, Poulet F, Vincendon M, et al. Water in the Martian regolith from OMEGA/Mars Express. Journal of Geophysical Research: Planets. 2014;119(8):1969–1989. doi:10.1002/2014JE004649.
Gross C, Al-Samir M, Bishop JL, Poulet F, Postberg F, Schubert D. Prospecting in-situ resources for future crewed missions to Mars. Acta Astronautica. 2024;223:15–24. doi:10.1016/j.actaastro.2024.07.003.
Riu L, Carter J, Poulet F, Cardesín-Moinelo A, Martin P. Global surficial water content stored in hydrated silicates at Mars from OMEGA/MEx. Icarus. 2023;398:115537. doi:10.1016/j.icarus.2023.115537.
Mustard JF, Murchie SL, Pelkey SM, Ehlmann BL, Milliken RE, Grant JA, Bibring JP, Poulet F, Bishop J, Dobrea EN, Roach L, Seelos F, Arvidson RE, Wiseman S, Green R, Hash C, Humm D, Malaret E, McGovern JA, Seelos K, Clancy T, Clark R, Marais DD, Izenberg N, Knudson A, Langevin Y, Martin T, McGuire P, Morris R, Robinson M, Roush T, Smith M, Swayze G, Taylor H, Titus T, Wolff M. Hydrated silicate minerals on Mars observed by the Mars Reconnaissance Orbiter CRISM instrument. Nature. 2008 Jul 17;454(7202):305-9. doi: 10.1038/nature07097. Epub 2008 Jul 16. PMID: 18633411.
Wernicke LJ, Jakosky BM. Martian hydrated minerals: a significant water sink. JGR Planets. 2021;126(3):e2019JE006351. doi:10.1029/2019JE006351.
Mustard JF. Sequestration of volatiles in the Martian crust through hydrated minerals. In: Volatiles in the Martian Crust. Elsevier; 2019. p. 247–263. doi:10.1016/B978-0-12-804191-8.00008-8.
Siljeström S, Czaja AD, Corpolongo A, et al. Evidence of sulfate-rich fluid alteration in Jezero Crater floor, Mars. JGR Planets. 2024;129(1):e2023JE007989. doi:10.1029/2023JE007989.
Karunatillake S, Wray JJ, Gasnault O, et al. Sulfates hydrating bulk soil in the Martian low and middle latitudes. Geophysical Research Letters. 2014;41(22):7987–7996. doi:10.1002/2014GL061136.
Vaniman D, Chipera S, Rampe E, et al. Gypsum on Mars: a detailed view at Gale Crater. Minerals. 2024;14(8):815. doi:10.3390/min14080815.
Clark BC, Morris RV, McLennan SM. Chemistry and mineralogy of outcrops at Meridiani Planum. Earth Planet Sci Lett. 2005;240(1):73–94. doi:10.1016/j.epsl.2005.09.040.
Ralphs M, Franz B, Baker T, Howe S. Water extraction on Mars for an expanding human colony. Life Sci Space Res (Amst). 2015 Nov;7:57-60. doi: 10.1016/j.lssr.2015.10.001. Epub 2015 Oct 22. PMID: 26553638.
Carter J, Poulet F, Bibring J-P, Mangold N, Murchie S. Hydrous minerals on Mars as seen by the CRISM and OMEGA imaging spectrometers: updated global view. JGR Planets. 2013;118:831–858. doi:10.1029/2012JE004145.
Murchie SL, Ehlmann BL, Arvidson RE. Geological water resources for humans on Mars: constraints from orbital spectral mapping and in situ measurements. Lunar Planet Sci. 2016;47:abstract #1261.
Murchie SL, Arvidson RE, Bishop JL, et al. Maximizing the science and resource mapping potential of orbital VSWIR spectral measurements of Mars. Planetary Science and Astrobiology Decadal Survey 2023-2032 white paper. Bull Am Astron Soc. 2021;53(4):e-id. 119.
Golombek M, Rapp D. Size-frequency distributions of rocks on Mars and Earth analog sites: implications for future landed missions. JGR. 1997;102:4117–4129.
Golombek M, Huertas A, Kipp D, Calef F. Rock abundance maps of the final four Mars Science Laboratory landing sites. Mars J. 2012;7:1–22. doi:10.1555/mars.2012.0001.
Inglevakis V. Martian Aqua: occurrence of water and appraisal of acquisition technologies. Manuscript under preparation. 2025.
Martínez GM, Newman CN, De Vicente-Retortillo A, et al. The modern near-surface Martian climate: a review of in-situ meteorological data from Viking to Curiosity. Space Sci Rev. 2017;212(1–2):295–338. doi:10.1007/s11214-017-0360-x.
Tamppari LK, Lemmon MT. Near-surface atmospheric water vapor enhancement at the Mars Phoenix lander site. Icarus. 2020;343:113624. doi:10.1016/j.icarus.2020.113624.
Titov DV. Water vapour in the atmosphere of Mars. Adv Space Res. 2002;29(2):183–191. doi:10.1016/S0273-1177(01)00568-3.
Titov DV, Markiewicz WJ, Thomas N, Keller HU, Sablotny RM, Tomasko MG, Lemmon MT, Smith PH. Measurements of the atmospheric water vapor on Mars by the Imager for Mars Pathfinder. JGR Planets. 1999;104(E4):9019–9026. doi:10.1029/1998JE900046.
Knutsen EW, Montmessin F, Verdier L, et al. Water vapor on Mars: a refined climatology and constraints on the near-surface concentration enabled by synergistic retrievals. JGR Planets. 2022;127(5). doi:10.1029/2022JE007252.
Rapp D. Human missions to Mars using the Starship. IgMin Res. Submitted July 2025.
Drake BG. Human exploration of Mars – Design Reference Architecture 5.0 (DRA-5). NASA Report SP-2009-566. 2009.
Bussey B, Hoffman SJ. Human Mars landing site and impacts on Mars surface operations. 2016 IEEE Aerospace Conference. 2016. doi:10.1109/AERO.2016.7500775. Available from: https://ntrs.nasa.gov/api/citations/20160001040/downloads/20160001040.pdf
Ming DW, Morris RV. Chemical, mineralogical, and physical properties of Martian dust and soil. Meeting: Dust in the Atmosphere of Mars and Its Impact on Human Exploration Workshop, Houston, TX, June 13–15, 2017.
Benkoula S, Sublemontier O, Patanen M, Nicolas C, Sirotti F, Naitabdi A, Gaie-Levrel F, Antonsson E, Aureau D, Ouf FX, Wada S, Etcheberry A, Ueda K, Miron C. Water adsorption on TiO2 surfaces probed by soft X-ray spectroscopies: bulk materials vs. isolated nanoparticles. Sci Rep. 2015 Oct 14;5:15088. doi: 10.1038/srep15088. PMID: 26462615; PMCID: PMC4604456.
Cannon KM. Mineral resources of Mars based on decades of sample analysis. Space and Planetary Resources. 2025;1:1. Available from: https://doi.org/10.1007/s44461-025-00001-8


 Scan and get link
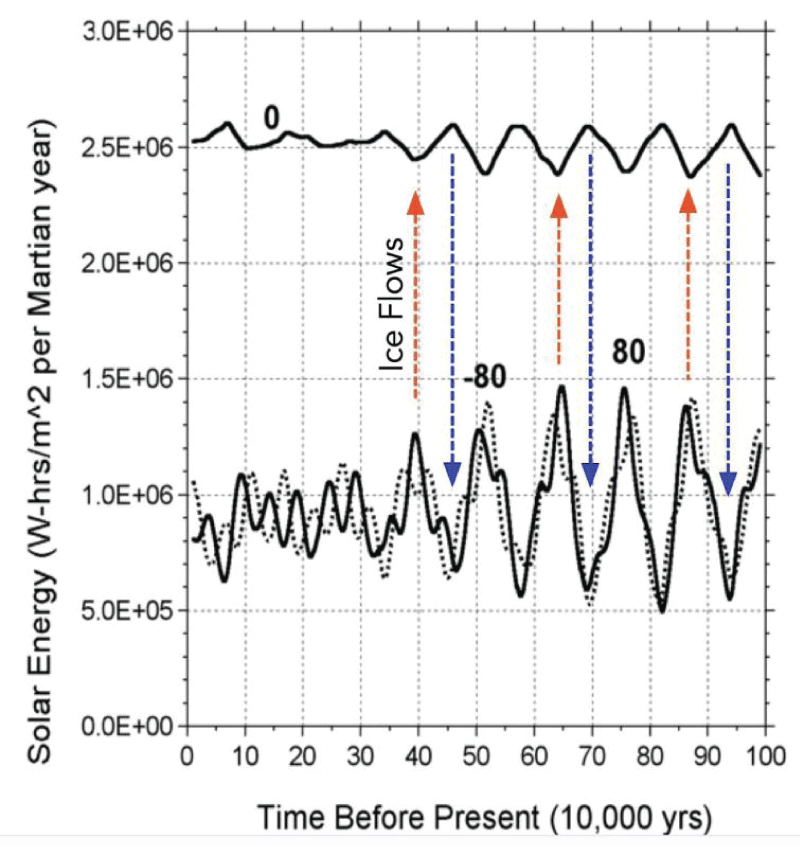
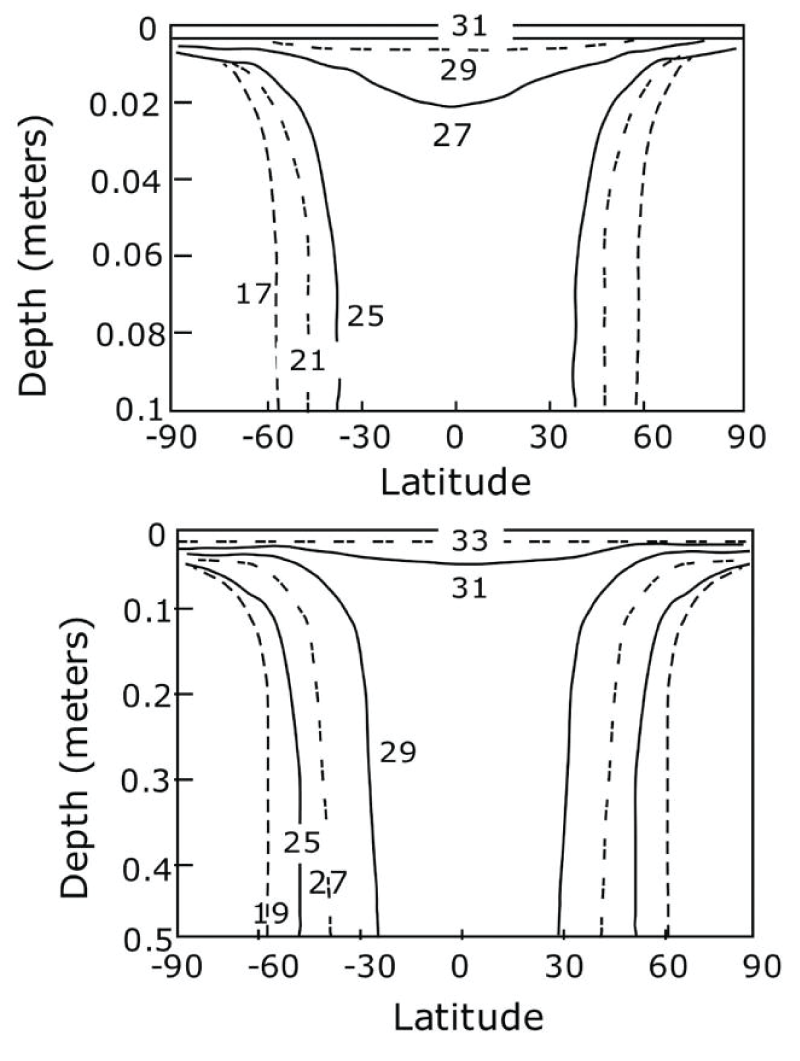
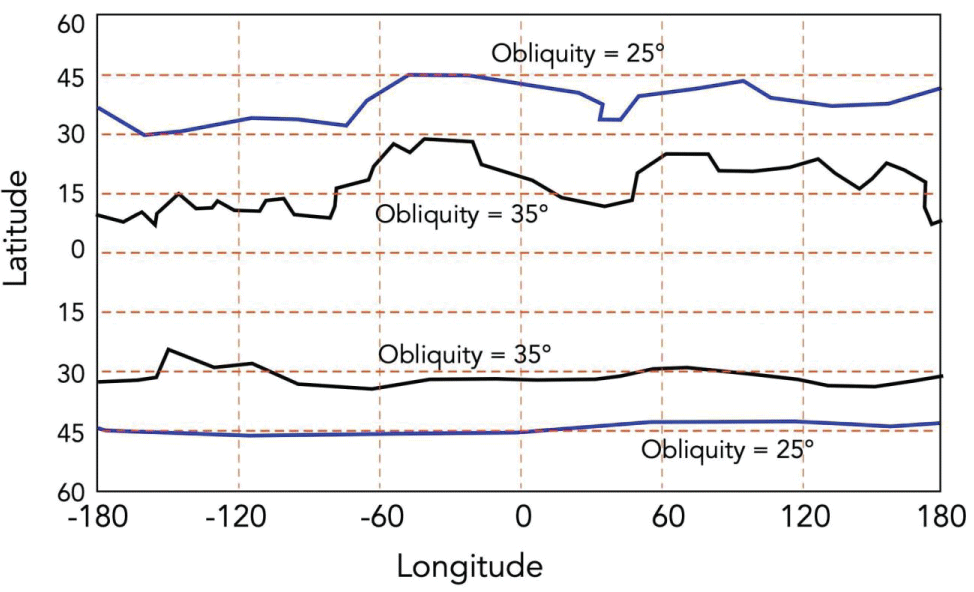
![Fraction of a year for which frost point is higher than subsurface temperature. Background shading shows regions of high thermal inertia. Mars landing sites are shown as circles. The vertical scale is latitude. Adapted from Figure 13 of Schorghofer and Aharonson [].](https://www.igminresearch.com/articles/figures/igmin322/igmin322.g004.png)
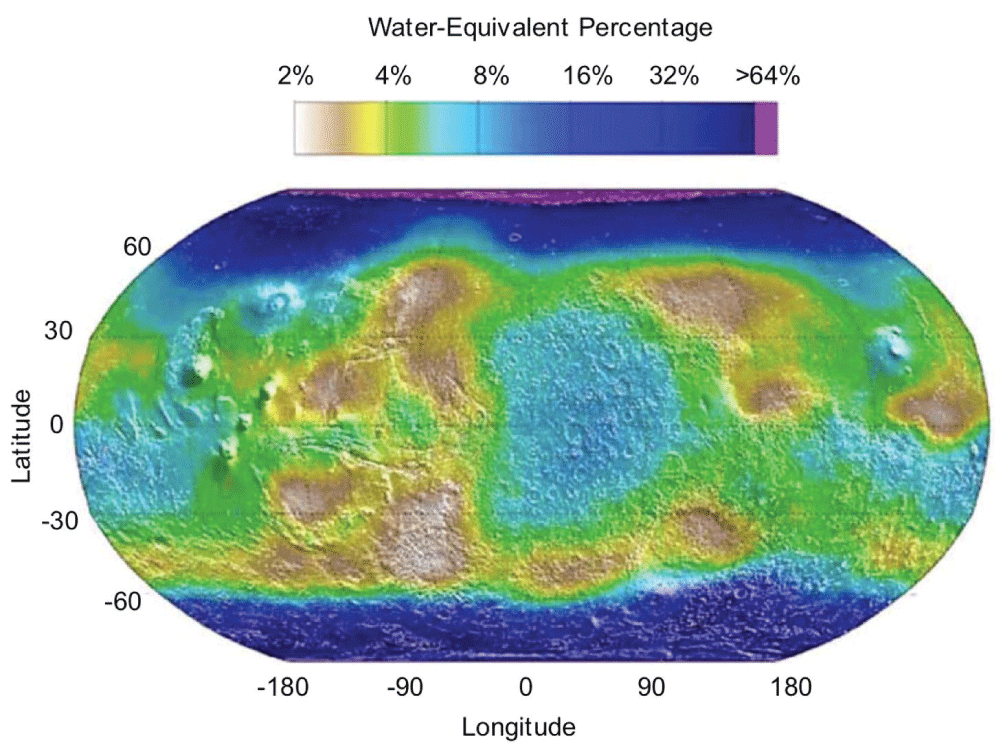
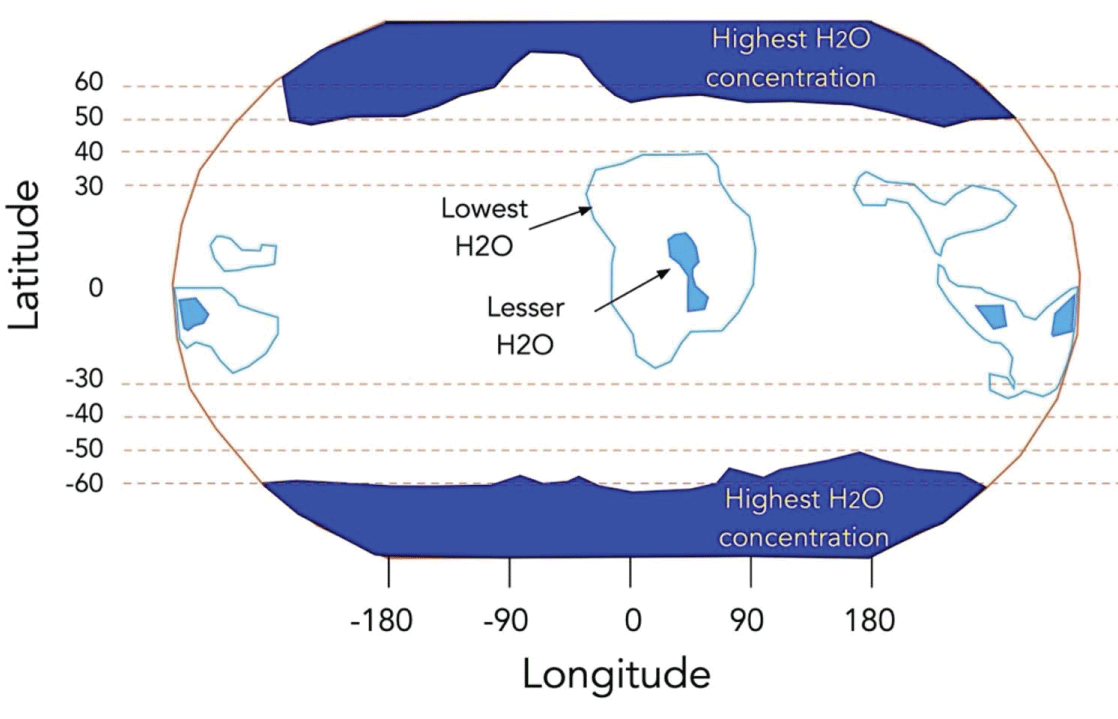
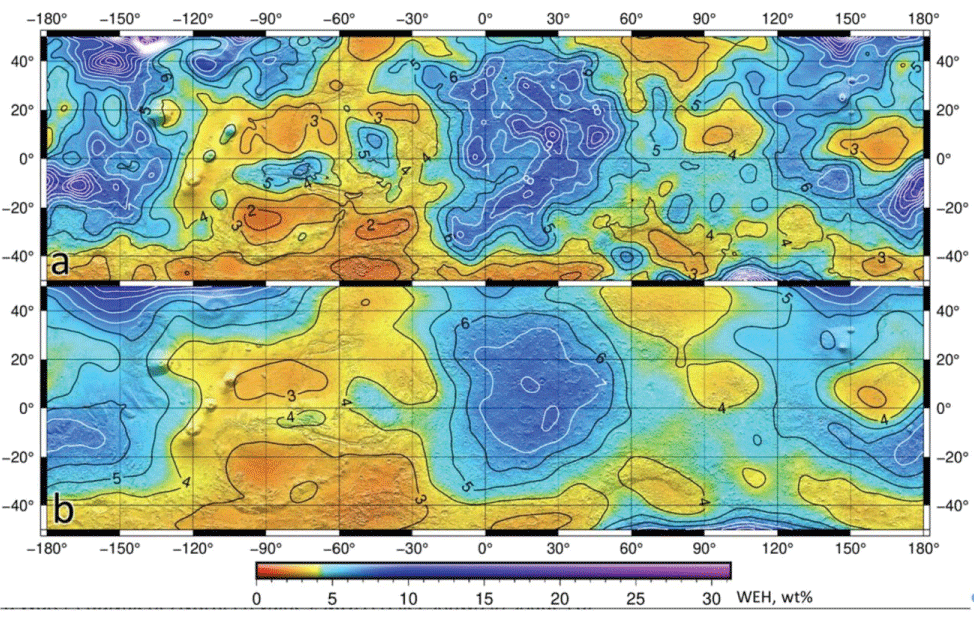
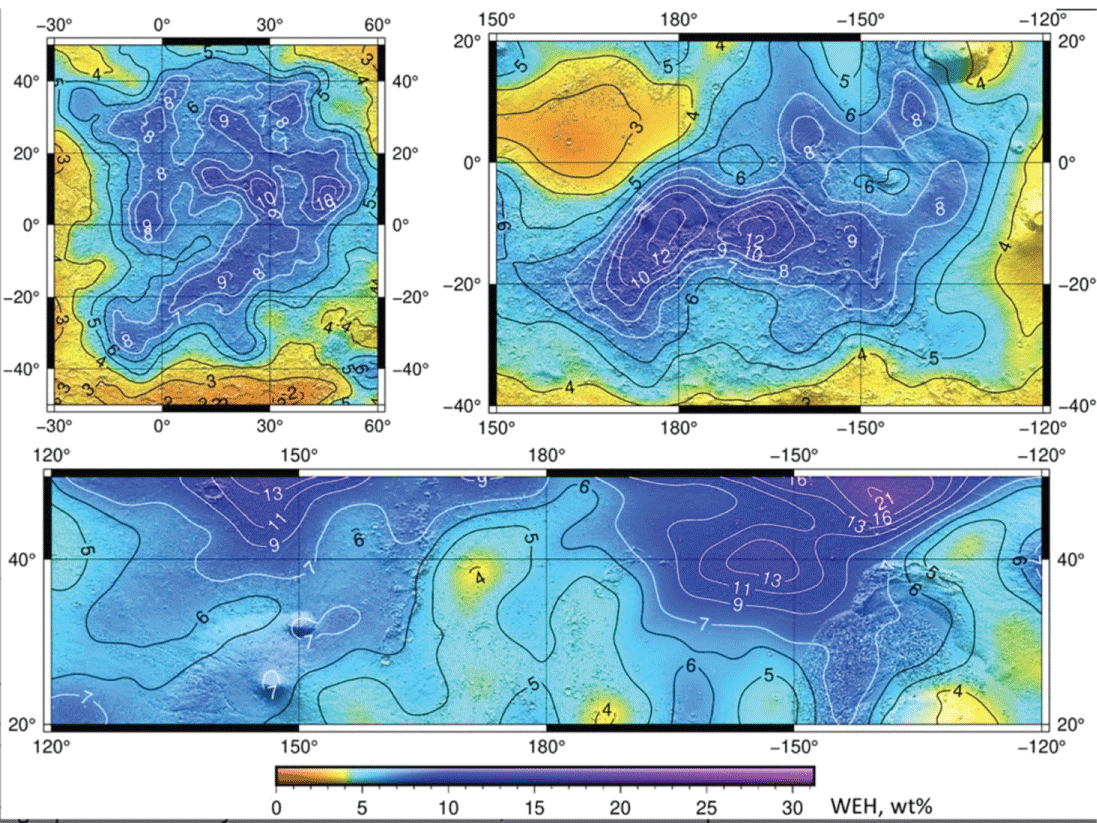
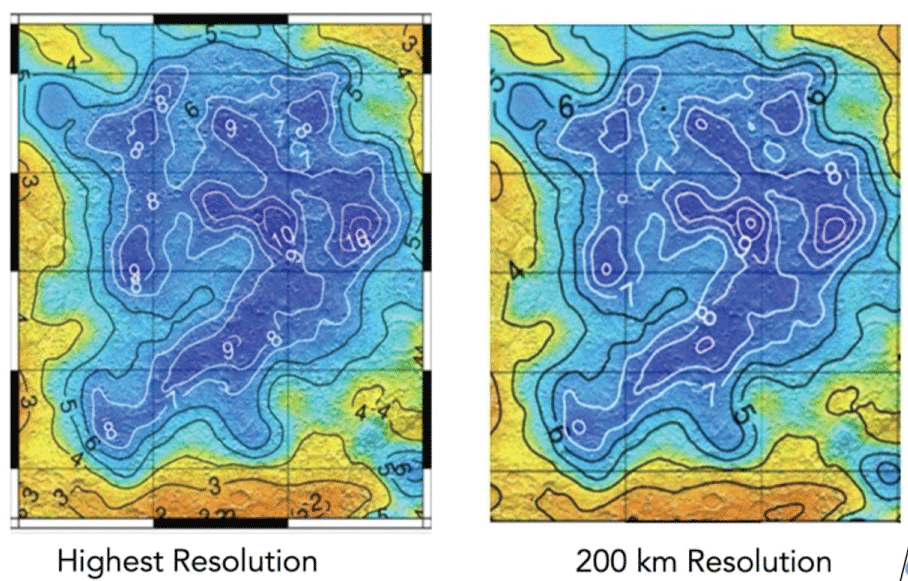
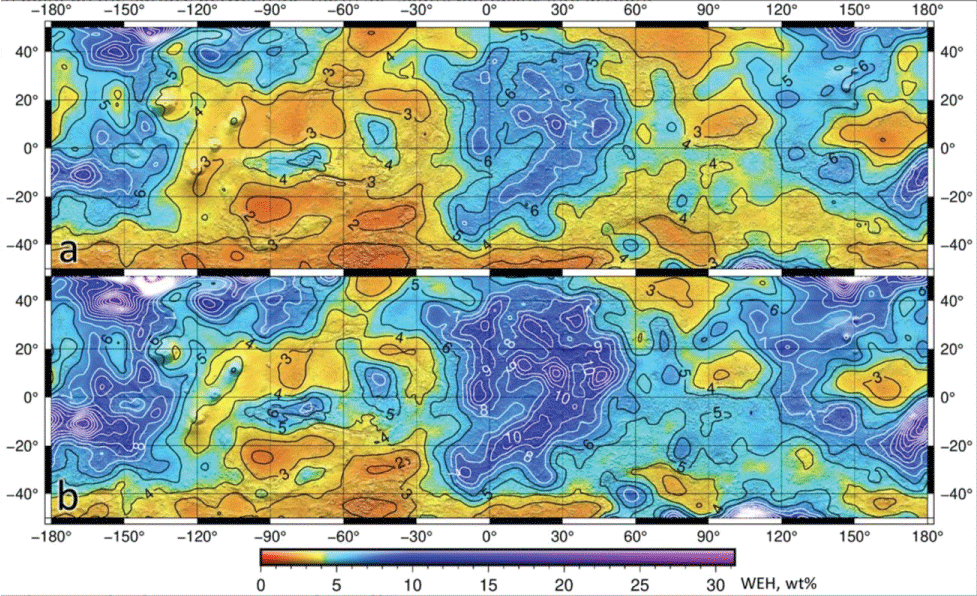
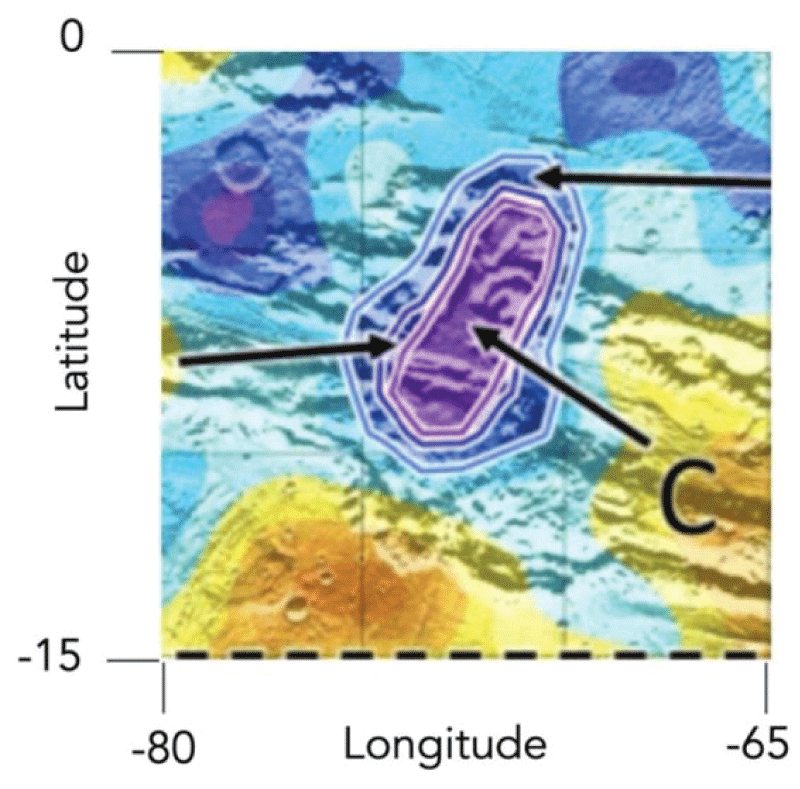
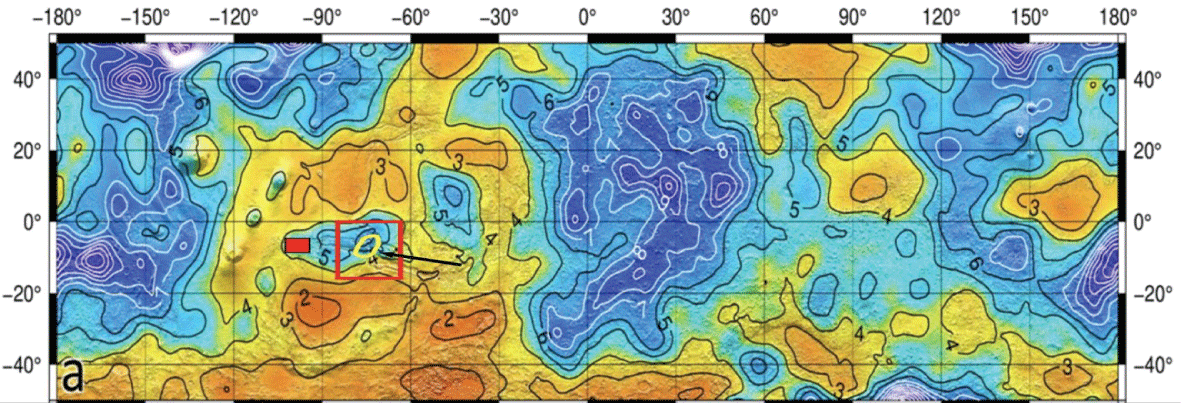
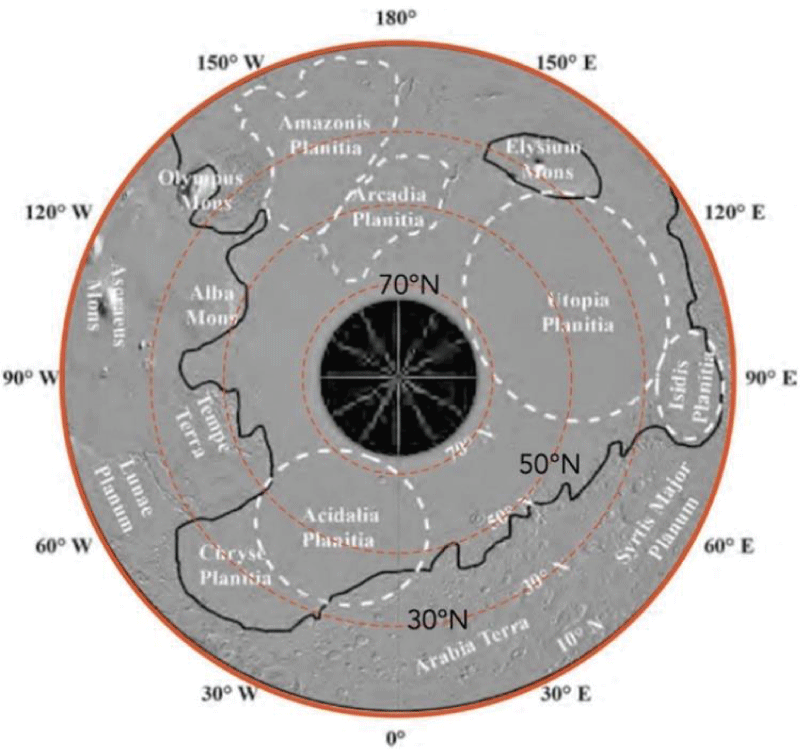
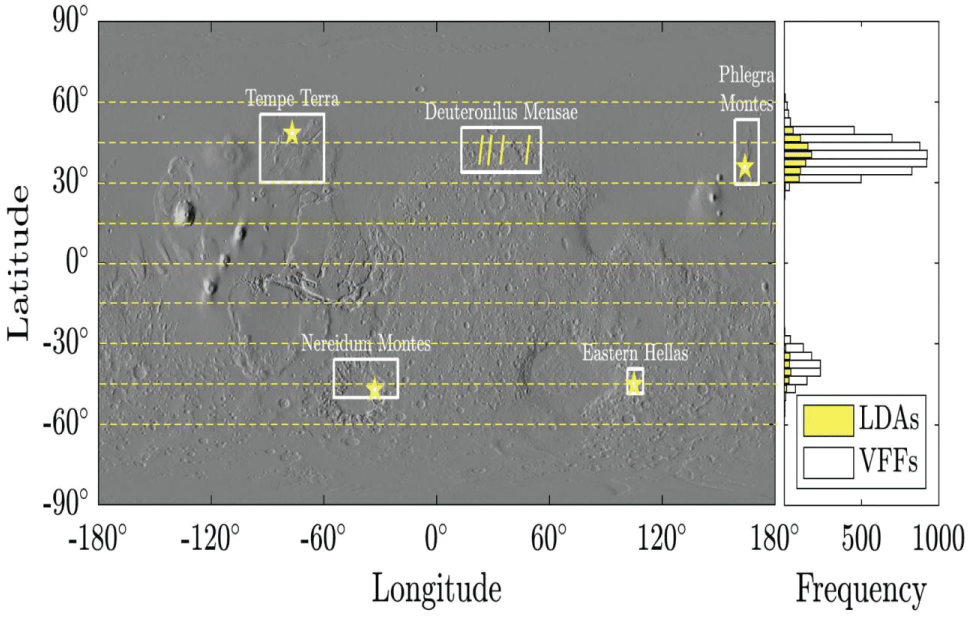
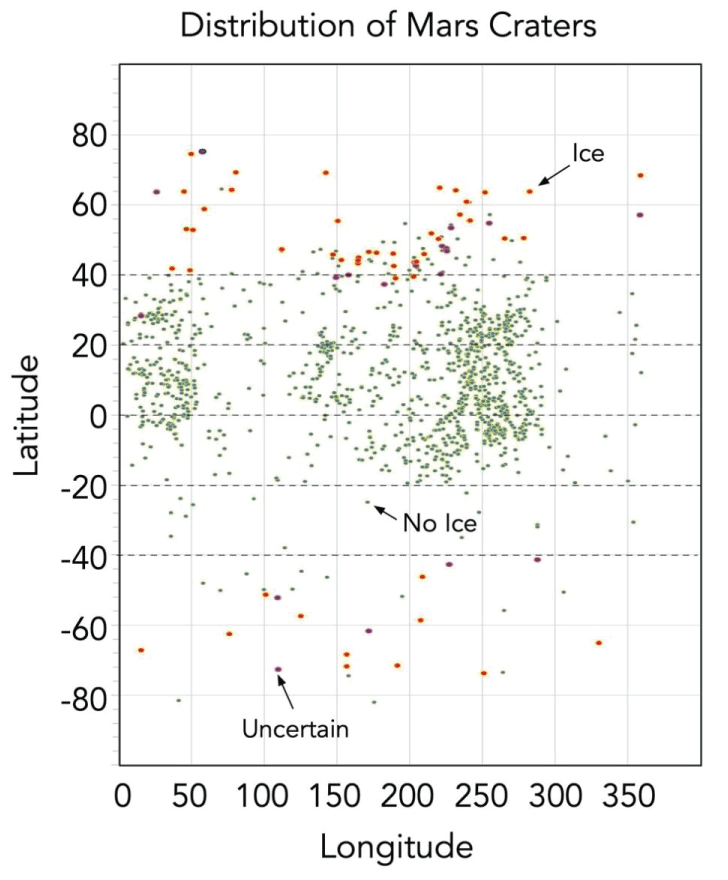
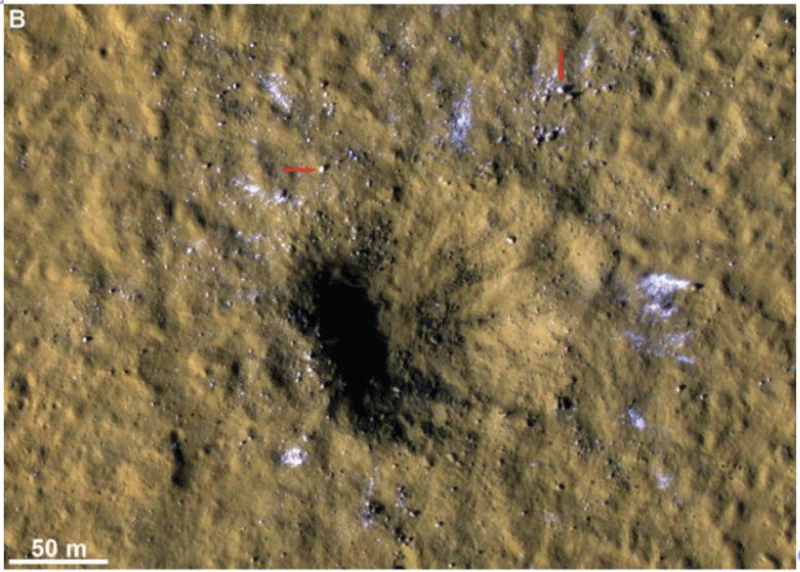
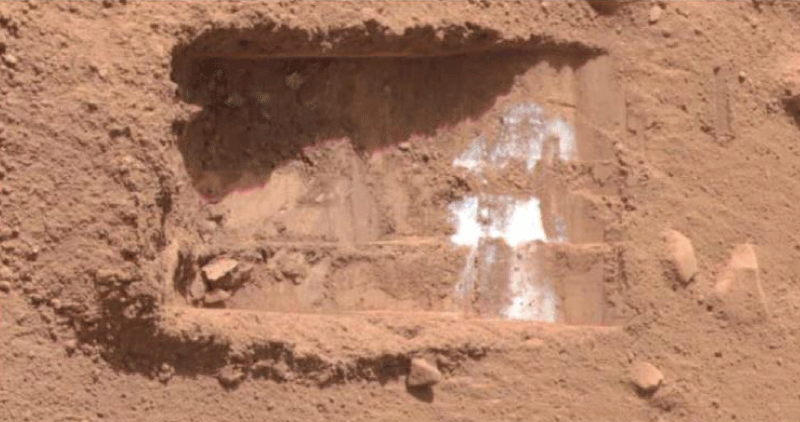
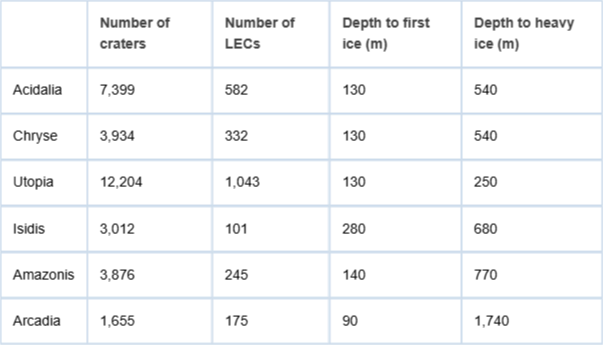

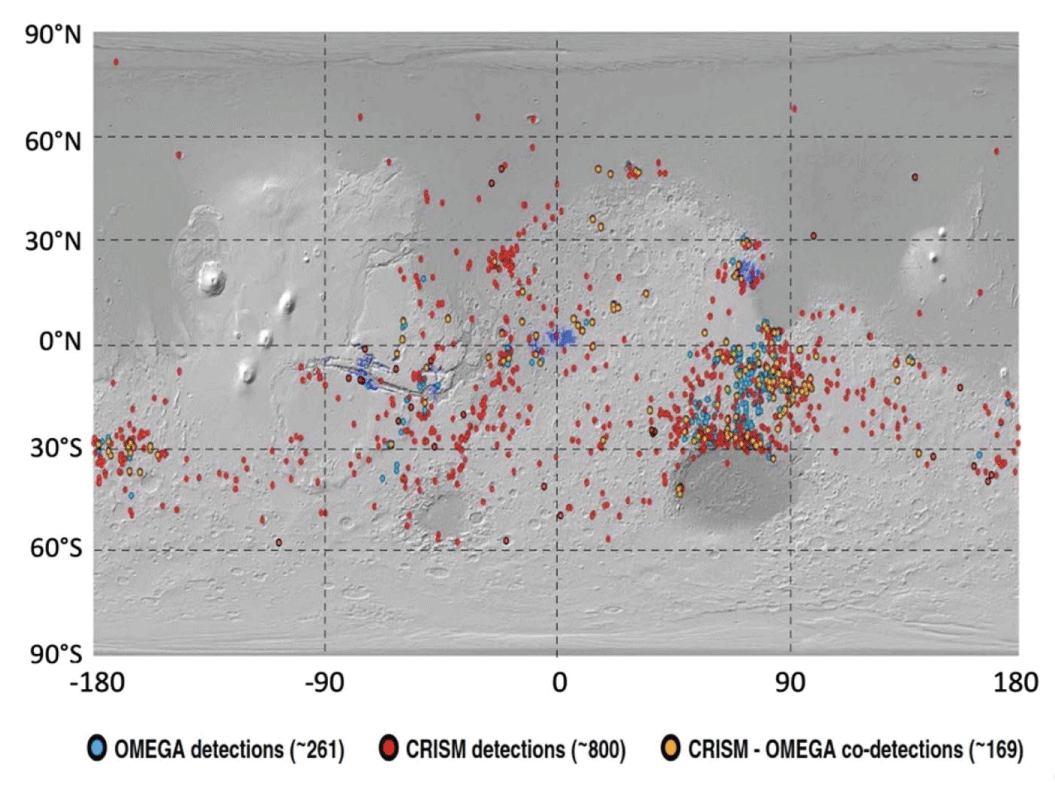
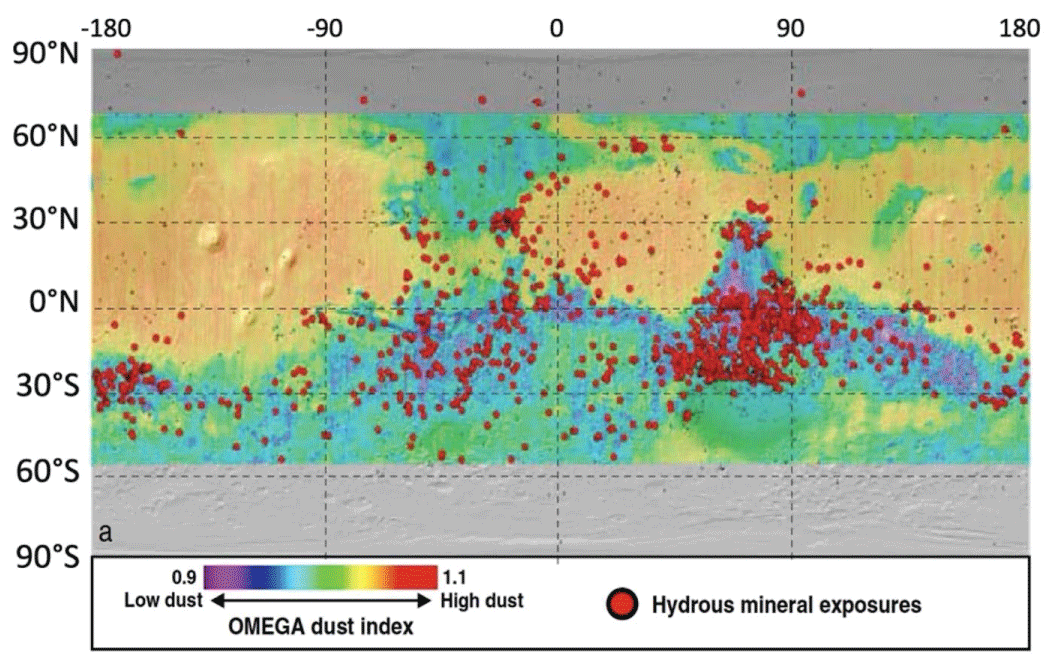

![Comparison of insolation on a horizontal surface summed over a Martian year at the equator (0) with a high southern latitude (80°S) and a high northern latitude (80°N). Red arrows show flow of H2O vapor from high latitude toward the equator and blue arrows show return of H2O vapor from equatorial region to high altitudes [5]. Provided by D. Rapp.](https://www.igminresearch.es/articles/figures/igmin322/igmin322.g001.png)
![Minimum depth to stability of ground ice vs. latitude for various Mars obliquities (a) upper figure: for bright dusty ground, and (b) lower figure: for dark rocky ground. Adapted from Figure 1 of Chamberlain and Boynton [7].](https://www.igminresearch.es/articles/figures/igmin322/igmin322.g002.png)
![Approximate interpretation Figure 10 of Chamberlain and Boynton [8]. The curves show the extent of ice stability for two levels of obliquity.](https://www.igminresearch.es/articles/figures/igmin322/igmin322.g003.png)
![Global variation of water content in upper ~ 1 m of Mars based on a uniform regolith model (no layers) using epi-thermal neutron data. Adapted from Figure 4 of Feldman, et al. 2004 [5,19].](https://www.igminresearch.es/articles/figures/igmin322/igmin322.g005.png)
![Simplified version of updated plot of Mars Odyssey data. Adapted from data in Figure 7 of Butcher [22].](https://www.igminresearch.es/articles/figures/igmin322/igmin322.g006.png)
![Water equivalent hydrogen maps, measured by collimated FREND/DSEN. (a) Upper map is collimated for maximum resolution (200 km). (b) Lower map is omni directional (550 km). Black and white isolines correspond to WEH values. Adapted from Figure 2 of Malakahov, et al. [26].](https://www.igminresearch.es/articles/figures/igmin322/igmin322.g007.png)
![Enhanced segments of the global map shown in Figure 7, showing details of three areas with most water content: Arabia Terra (top left), Medusa Fossae (top right) and Arcadia Planitia (bottom). Adapted from Figure 3 of Malakahov, et al. [26].](https://www.igminresearch.es/articles/figures/igmin322/igmin322.g008.png)
![Comparison of the Arabia Terra segment of the WEH map at highest resolution to map at 200 km resolution. The small areas with WEH = 10% increase in size. Adapted from Figures 2 and 3 of Malakahov, et al. [26].](https://www.igminresearch.es/articles/figures/igmin322/igmin322.g009.png)
![Minimum (a) and maximum (b) Water Equivalent Hydrogen (WEH) maps accompany the mean WEH map on Figure 8 and show the range of possible values, considering the measurements uncertainties with +σ and -σ. Adapted from Figure 5 of Malakahov, et al. [26].](https://www.igminresearch.es/articles/figures/igmin322/igmin322.g010.png)
![The small (purple) region with observed 40.3% WEH. Adapted from Figure 1 of Mitrofanov, et al. [27].](https://www.igminresearch.es/articles/figures/igmin322/igmin322.g011.png)
![Water equivalent hydrogen map, measured by collimated FREND/DSEN – collimated for maximum resolution (200 km). The small area studied by Mitrofanov, et al. [27] is superimposed as a yellow elliptical curve. Adapted from Figure 2 of Malakahov, et al. [26] and Figure 1 of Mitrofanov, et al. [27].](https://www.igminresearch.es/articles/figures/igmin322/igmin322.g012.png)
![Water equivalent hydrogen map, measured by collimated FREND/DSEN – collimated for maximum resolution (200 km). The small area studied by Mitrofanov, et al. [27] is superimposed as a yellow elliptical curve. Adapted from Figure 2 of Malakahov, et al. [26] and Figure 1 of Mitrofanov, et al. [27].](https://www.igminresearch.es/articles/figures/igmin322/igmin322.g013.png)
![Regions explored by Steinberg, et al. [49]. The rectangles define regions where LDA occur, the stars are where observations were made and analyzed, and the lines at DM represent traces. Adapted from Figure 1 of Steinberg, et al. [49].](https://www.igminresearch.es/articles/figures/igmin322/igmin322.g014.png)
![Locations of 1,203 craters, showing which were dry, which showed ice, and which might have ice. Plotted from data provided by Daubar [17].](https://www.igminresearch.es/articles/figures/igmin322/igmin322.g015.png)
![Large crater at 35.1°N, 189.8°E consistent with water ice in the ejecta. Adapted from Figure 1 of Dundas, et al. [56].](https://www.igminresearch.es/articles/figures/igmin322/igmin322.g016.png)
![Near-surface ice revealed by digging on the Phoenix mission. Adapted from Reference [66].](https://www.igminresearch.es/articles/figures/igmin322/igmin322.g017.png)
![Global map of hydrous mineral detections on Mars. Each dot indicates the position of a hydrous mineral exposure detected either by CRISM (red), OMEGA (blue) or jointly by both instruments (orange). Only one exposure is counted per CRISM observation regardless of the number of different hydrous mineral species found. Adapted from Figure 1 of Carter, et al. [79].](https://www.igminresearch.es/articles/figures/igmin322/igmin322.g018.png)
![Comparison of hydrous mineral exposures to very dusty regions (yellow to orange). . Adapted from Figure 4 of Carter, et al. [79].](https://www.igminresearch.es/articles/figures/igmin322/igmin322.g019.png)
![Fraction of a year for which frost point is higher than subsurface temperature. Background shading shows regions of high thermal inertia. Mars landing sites are shown as circles. The vertical scale is latitude. Adapted from Figure 13 of Schorghofer and Aharonson [5,12].](https://www.igminresearch.es/articles/figures/igmin322/igmin322.g004.png)
![<p>Review of layered ejecta craters (LECs) at the Planitas on Mars [38].</p>](https://www.igminresearch.es/articles/fulltext/table_images/igmin322/Table1.png)